10 reasons why US medical care costs so much
The top 10 reasons US healthcare costs 2X more
1) Administrative complexity
The US has hundreds of insurers, each with different billing codes, forms, and requirements. Hospitals and clinics spend enormous sums on billing staff, compliance, and paperwork — far more than any other country.
2) Lack of price transparency and negotiation power
Unlike most countries where governments negotiate drug and service prices, the US largely leaves this to fragmented private insurers, giving providers more leverage to set high prices.
3) Prescription drug pricing
The US pays 2–4× more for the same drugs than peer nations. Manufacturers face few regulatory constraints on pricing, and patent protections (plus pay-to-delay deals) limit generic competition.
4) Fee-for-service payment model
Providers are paid per procedure, incentivizing volume over value. More tests, surgeries, and specialist visits generate more revenue, regardless of whether outcomes improve.
5) Consolidation of hospitals and health systems
Massive mergers have reduced competition. When a health system dominates a region, it can demand higher prices from insurers — and those costs pass to patients and employers.
6) High physician and specialist salaries
— US doctors earn significantly more than their counterparts abroad, partly due to medical school debt, limited residency slots (restricting supply), and specialty-skewed training incentives.
7) Defensive medicine and malpractice costs
Fear of lawsuits drives physicians to order unnecessary tests and procedures. Malpractice insurance premiums add further cost, especially in high-risk specialties.
8) fit-driven system with equity investors
Private equity ownership of hospital systems, physician groups, and nursing facilities prioritizes returns, leading to cost-cutting on staff and price increases on services.
9) Chronic disease burden
The US has high rates of obesity, diabetes, heart disease, and other preventable conditions — driven by diet, sedentary lifestyles, and social factors — generating enormous downstream treatment costs.
10) Lack of universal coverage creating cost-shifting
Uninsured and underinsured patients often delay care until they need expensive emergency treatment. Hospitals then shift those unpaid costs onto insured patients through higher prices.
The net result: The US spends roughly $13,000+ per person per year on healthcare — about twice the average of other wealthy nations — yet ranks poorly on life expectancy, infant mortality, and other key outcomes. The system rewards treatment over prevention and complexity over efficiency.
Why the U.S. Spends So Much on Healthcare (Wall Street Journal)
The deadly cost of going without health insurance in America
Roughly 27 million Americans lack health insurance, and an estimated 18,000 to 45,000 of them die each year because of it. Being uninsured or underinsured in the United States shortens lives, worsens chronic disease, drives financial ruin, and compounds mental health crises — with the heaviest burden falling on communities of color, low-income families, and immigrants.
The consequences are not abstract: uninsured adults face a 40% higher risk of death than their insured peers, are diagnosed with cancer at later stages, and accumulate debt that destabilizes entire households. The United States remains the only wealthy nation without universal coverage, and recent policy changes — including Medicaid unwinding and potential subsidy expirations — threaten to push millions more into the ranks of the uninsured.
Uninsured Americans die 3.7 years sooner
The most robust evidence on mortality comes from a convergence of observational and quasi-experimental studies. Wilper et al. (2009), analyzing NHANES III data with mortality follow-up, found that uninsured adults aged 17–64 had a hazard ratio of 1.40 (95% CI: 1.06–1.84) for death compared to privately insured adults after adjusting for age, sex, race, income, education, health status, BMI, smoking, and alcohol use. Applied to Census data, this translated to approximately 44,789 excess deaths per year. The Institute of Medicine's earlier estimate was more conservative at 18,314 excess deaths annually, using a hazard ratio of 1.25. A 2017 comprehensive review by Woolhandler and Himmelstein in the Annals of Internal Medicine concluded that the cumulative evidence "strengthens confidence" that insurance saves lives, with odds of dying among the uninsured ranging 1.03 to 1.41 times higher across reviewed studies.
Quasi-experimental evidence from Medicaid expansion provides the strongest causal support. Sommers et al. (2012, NEJM) found that states expanding Medicaid experienced a 6.1% relative reduction in mortality — 19.6 fewer deaths per 100,000. A University of Chicago working paper estimated that Medicaid expansion saved roughly 3,220 lives per year in expansion states and projected that 12,800 additional lives could have been saved had non-expansion states also expanded. A 2025 American Journal of Public Health study found that expansion states experienced 31.8 fewer deaths per 100,000 person-years during 2018–2022, with the largest reductions in heart disease and liver disease deaths.
Life expectancy differences are difficult to isolate to insurance alone, but suggestive evidence abounds. U.S. life expectancy trails comparable high-income nations by 3.7 years — and the U.S. is the only wealthy country without universal coverage. A striking natural experiment in cystic fibrosis found patients live 10 years longer in Canada than in the U.S.; among privately insured Americans, survival matched Canadian levels, implicating insurance gaps as the primary driver of the difference.
Chronic diseases spiral out of control without coverage
Insurance status does not merely determine whether people see doctors — it determines whether treatable conditions remain treatable. An estimated 11.4 million working-age Americans with chronic conditions were uninsured as of the mid-2000s, including 1.3 million heart attack or stroke survivors. The consequences of managing these conditions without coverage have grown worse over time.
The hypertension data is particularly striking. Analysis of NHANES data from 1988 to 2010 revealed a widening gap in blood pressure control: in the late 1980s, control rates were statistically similar between insured (28.5%) and uninsured (25.6%) adults. By 2005–2010, control had climbed to 52.5% among the insured but only 29.8% among the uninsured — a 23-percentage-point chasm. The same pattern held for cholesterol: LDL control stood at 35.1% for insured adults versus 11.3% for uninsured by 2009–2012, with the gap having doubled over a decade. Uninsured adults with chronic conditions were nearly four times more likely to have gone without a health professional visit in the past year and six times more likely to rely on emergency departments as their usual source of care.
Cancer outcomes provide the starkest illustration of what delayed diagnosis means. A landmark 2022 study in CA: A Cancer Journal for Clinicians, analyzing over 70% of newly diagnosed cancers in the U.S., found that uninsured patients were 2.39 times more likely to be diagnosed at an advanced stage (III/IV) across 17 cancer types. The survival penalty was so severe that uninsured patients with Stage I cancer had worse survival than privately insured patients with Stage II disease — a finding that held for six specific cancer sites including colorectal, prostate, and liver cancers. For colon cancer specifically, privately insured patients were twice as likely to receive guideline-recommended treatment compared to uninsured patients. Insurance disparities accounted for roughly half of the Black-White survival gap in colorectal cancer among working-age adults.
Preventive care — the first line of defense against these outcomes — is dramatically underutilized by the uninsured. Mammography rates among women aged 50–74 stood at 74% for insured versus 37% for uninsured. Colonoscopy screening showed similar gaps. Nearly half of uninsured adults (46.6%) had not seen a doctor in the past 12 months, compared to 15.6% of the privately insured. The uninsured were five times more likely to lack a usual source of care.
Care is delayed 4X more often in uninsured
The scale of foregone medical care in the United States is staggering. As of 2024, 31% of uninsured adults reported delaying or forgoing medical care due to cost, compared to 8% of insured adults. Among uninsured adults under 65, the figure reached 75% — three in four — according to a May 2025 KFF tracking poll. A Gallup survey found that 72.2 million Americans (roughly one in three adults) skipped needed healthcare in a single three-month period in 2024 due to cost.
The consequences of that delay are not hypothetical. Among uninsured adults who postponed care, 42% reported their health worsened as a direct result, compared to 20% of insured adults. The types of care most commonly skipped include dental care (35% of all adults), vision services (25%), doctor visits (24%), and mental health care (18%). Prescription non-adherence is pervasive: three in ten adults with chronic conditions skip doses or leave prescriptions unfilled due to cost, contributing to an estimated $5 billion annually in avoidable hospitalizations.
The underinsured face nearly identical barriers to the completely uninsured. The Commonwealth Fund's 2024 Biennial Survey found that 23% of insured working-age adults — about 28 million people — were underinsured, meaning their deductibles or out-of-pocket costs exceeded 5–10% of household income. Among the underinsured, 57% reported forgoing care because of cost, and 44% carried medical debt. Two-thirds of underinsured adults had employer-based coverage, undermining the assumption that having a job with benefits provides adequate protection. Adults with multiple chronic conditions in high-deductible plans were 5.75 times more likely to delay care than adequately insured adults.
The number of uninsured Americans reached 27.1 million in 2024 (8.2% of the population), with the children's uninsured rate rising significantly to 5.1% from 3.9% the prior year, driven largely by Medicaid unwinding. Some 25.2 million people were disenrolled from Medicaid during the unwinding process from April 2023 through December 2024. Among those disenrolled, 70% were left at least temporarily uninsured, and 56% skipped or delayed care during the transition.
Medical debt ($200 Billion) has become a defining feature of American financial life
The financial wreckage of America's insurance gaps extends far beyond hospital bills. Americans collectively owe at least $220 billion in medical debt, according to Peterson-KFF analysis of Census data. Approximately 100 million adults carry some form of healthcare-related debt — encompassing bills on credit cards, amounts owed to collections, and money borrowed from family. Medical debt was the single largest category of collections debt on credit reports, constituting 58% of all collection tradelines as recently as 2021.
The bankruptcy connection, while methodologically debated, is undeniable in its human toll. Himmelstein et al. (2019, AJPH) found that 66.5% of all U.S. bankruptcies involved medical contributors — either direct expenses or illness-related work loss — equating to roughly 530,000 medical bankruptcies annually. Critically, three-quarters of those filing had insurance, underscoring that coverage alone does not prevent financial catastrophe. A contrasting econometric analysis by Dobkin et al. (2018, American Economic Review) estimated that hospital admissions directly trigger fewer than 5% of bankruptcies but documented severe economic consequences nonetheless: insured adults aged 50–59 experienced an 11-percentage-point decline in employment and a 20% decline in earnings ($9,000/year) within three years of hospitalization.
The uninsured face a uniquely punitive pricing structure. Hospital chargemaster rates — the sticker prices hospitals set — average 164% higher than negotiated insurer rates. Because uninsured patients lack a payer to negotiate on their behalf, they are the most likely to be billed at these inflated prices. In extreme cases, chargemaster markups reach 10 to 20 times allowable Medicare costs.
Medical debt cascades into housing instability, diminished credit access, and compromised basic needs. A 2026 JAMA Network Open study found that 23.5% of adults with medical debt experienced housing instability the following year, compared to just 5.8% of those without such debt. Among those struggling with medical bills, 34–39% reported being unable to pay for food, heat, or housing. Half of all adults said they would be unable to pay a $500 unexpected medical bill without borrowing. Medical bankruptcy is nearly unique to the United States: the U.S. rate dwarfs Canada (19%), Australia (10%), and the UK (8.2%).
The mental health toll compounds every other harm
Lack of insurance creates a vicious cycle with mental health: uninsured individuals are more likely to develop mental health conditions, less likely to receive treatment, and the resulting financial strain further worsens psychological well-being. Over 54% of adults with any mental illness did not receive treatment in 2023, with cost cited by 59.8% as the reason. Among the uninsured specifically, 72% reported structural barriers to mental health care — cost, lack of coverage, or not knowing where to seek help.
Medical debt amplifies the crisis. A 2024 JAMA Psychiatry study found that 27.3% of adults with current depression and 26.2% with current anxiety reported medical debt, compared to roughly 9.5% of those without these conditions. Medical debt was associated with a more than two-fold increase in delayed or foregone mental health treatment. Nearly 40% of depressed adults with medical debt did not seek care at all. Medical financial hardship was associated with 3.58 times higher odds of serious psychological distress, according to a 2024 analysis of NHIS data.
Insurance coverage literally saves lives from suicide. CDC data show suicide rates are 26% lower in counties with the highest insurance coverage compared to those with the least. State-level analysis found that Medicaid expansion was associated with 0.40 fewer suicides per 100,000 — translating to an estimated 1,818 fewer suicides from 2015 to 2018. For substance use disorders, the treatment gap is even wider: 85.4% of the 48.5 million Americans with a substance use disorder in 2023 received no treatment at all.
Coverage gaps hit hardest along lines of race, income, and geography
The consequences of uninsurance are not distributed equally. They concentrate along America's deepest fault lines of inequality, compounding pre-existing disparities in health and wealth.
- Race and ethnicity: American Indian/Alaska Native adults face the highest uninsured rate at 18.7%, followed by Hispanic/Latino adults at 17.9% — nearly three times the White rate of 6.5%. Black adults are uninsured at 9.7%. These gaps translate directly into disparate outcomes: Black adults are 50% more likely to carry medical debt, and among adults who would gain coverage under full Medicaid expansion, 65% are people of color.
- Income: Approximately one in four working-age adults living in poverty is uninsured. In the 10 states that have not expanded Medicaid, roughly 1.6 million adults fall into the "coverage gap" — earning too much for Medicaid but too little for marketplace subsidies. The median non-expansion state sets Medicaid eligibility for parents at just 34% of the federal poverty level, about $9,000 per year for a family of three.
- Geography: The uninsured rate in non-expansion states (15.5% for working-age adults) is nearly double that of expansion states (8.9%). Texas leads with a 16.7% uninsured rate; Massachusetts sits at 2.8%. Non-expansion states cluster in the South, where poverty rates, chronic disease burden, and racial health disparities are already highest.
- Immigration status: Half of likely undocumented immigrant adults — 50% — are uninsured, compared to 8% of U.S.-born citizens. Federal law bars undocumented immigrants from Medicaid, CHIP, and marketplace coverage. Fear and confusion about eligibility suppress enrollment even among eligible members of mixed-status families.
- Age and gender: Young adults aged 19–25 have the highest uninsured rate of any age group at 14%, coinciding with the highest prevalence of mental illness (30.6%). Men are uninsured at higher rates than women (9% vs. 7%), partly because Medicaid covers more women through pregnancy and parental eligibility categories.
Conclusion
The evidence is unambiguous: lack of health insurance in America is not merely an inconvenience but a systemic driver of premature death, preventable suffering, and financial devastation. The 40% excess mortality risk for uninsured adults, the doubling of late-stage cancer diagnoses, and the $220 billion in medical debt represent failures with few parallels among peer nations. What makes these findings especially urgent is their trajectory. The Medicaid unwinding has already stripped coverage from millions, the coverage gap persists in ten states, and projected policy changes could add 10 to 14 million more uninsured by 2034. The data consistently show that insurance expansion — particularly Medicaid — reduces mortality, improves chronic disease management, narrows racial disparities, and prevents financial catastrophe. The costs of inaction are measured not in dollars alone but in years of life lost, diseases left to progress, and families driven into poverty by the price of staying alive.
Related in VitaminDWiki
- Perhaps 4,000 dollars annual less health care costs if supplement with 5 dollars of Vitamin D
- Sick people are more profitable than healthy ones
- How might hospitals be incentivized to have healthier patients
- US healthcare again ranked worst, as it has for 20 years
- US Healthcare is 2X more expensive than in other countries - what can be done
- US Healthcare professionals make a lot of money
- U.S. healthcare system (and its investors) are really good at monetizing illness, but not wellness
- The disinformation playbook problems of US healthcare - Grant
- Extremely Big Pharma - many studies
Vitamin D prevents health problems and reduces healthcare costs
- A drug that could reduce all these health problems is worth a Trillion dollars - video Holick
- An ounce of prevention is worth a pound of cure (might Vitamin D be worth several pounds)
- Vitamin D has been found to be cost-effective by many studies
- Giving free vitamin D to every Iranian would pay for itself by just reducing CVD
- People with extremely low vitamin D levels consume 2X more health care dollars – 2018
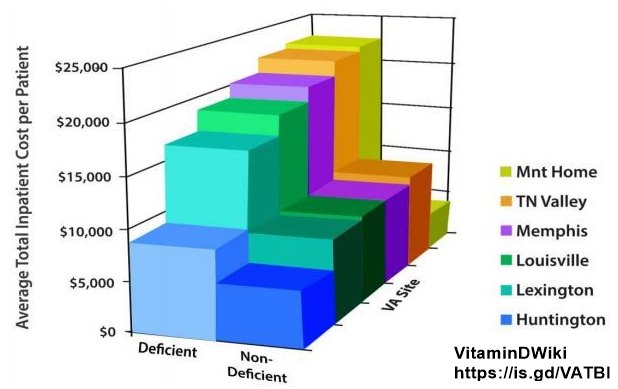
- VA found health care cost 1/2 as much if veteran was not Vitamin D deficient