Native Americans -the worst health in America (and worst funded)
Native American Health Disparities: Data Compendium for Prevention Messaging
Overview
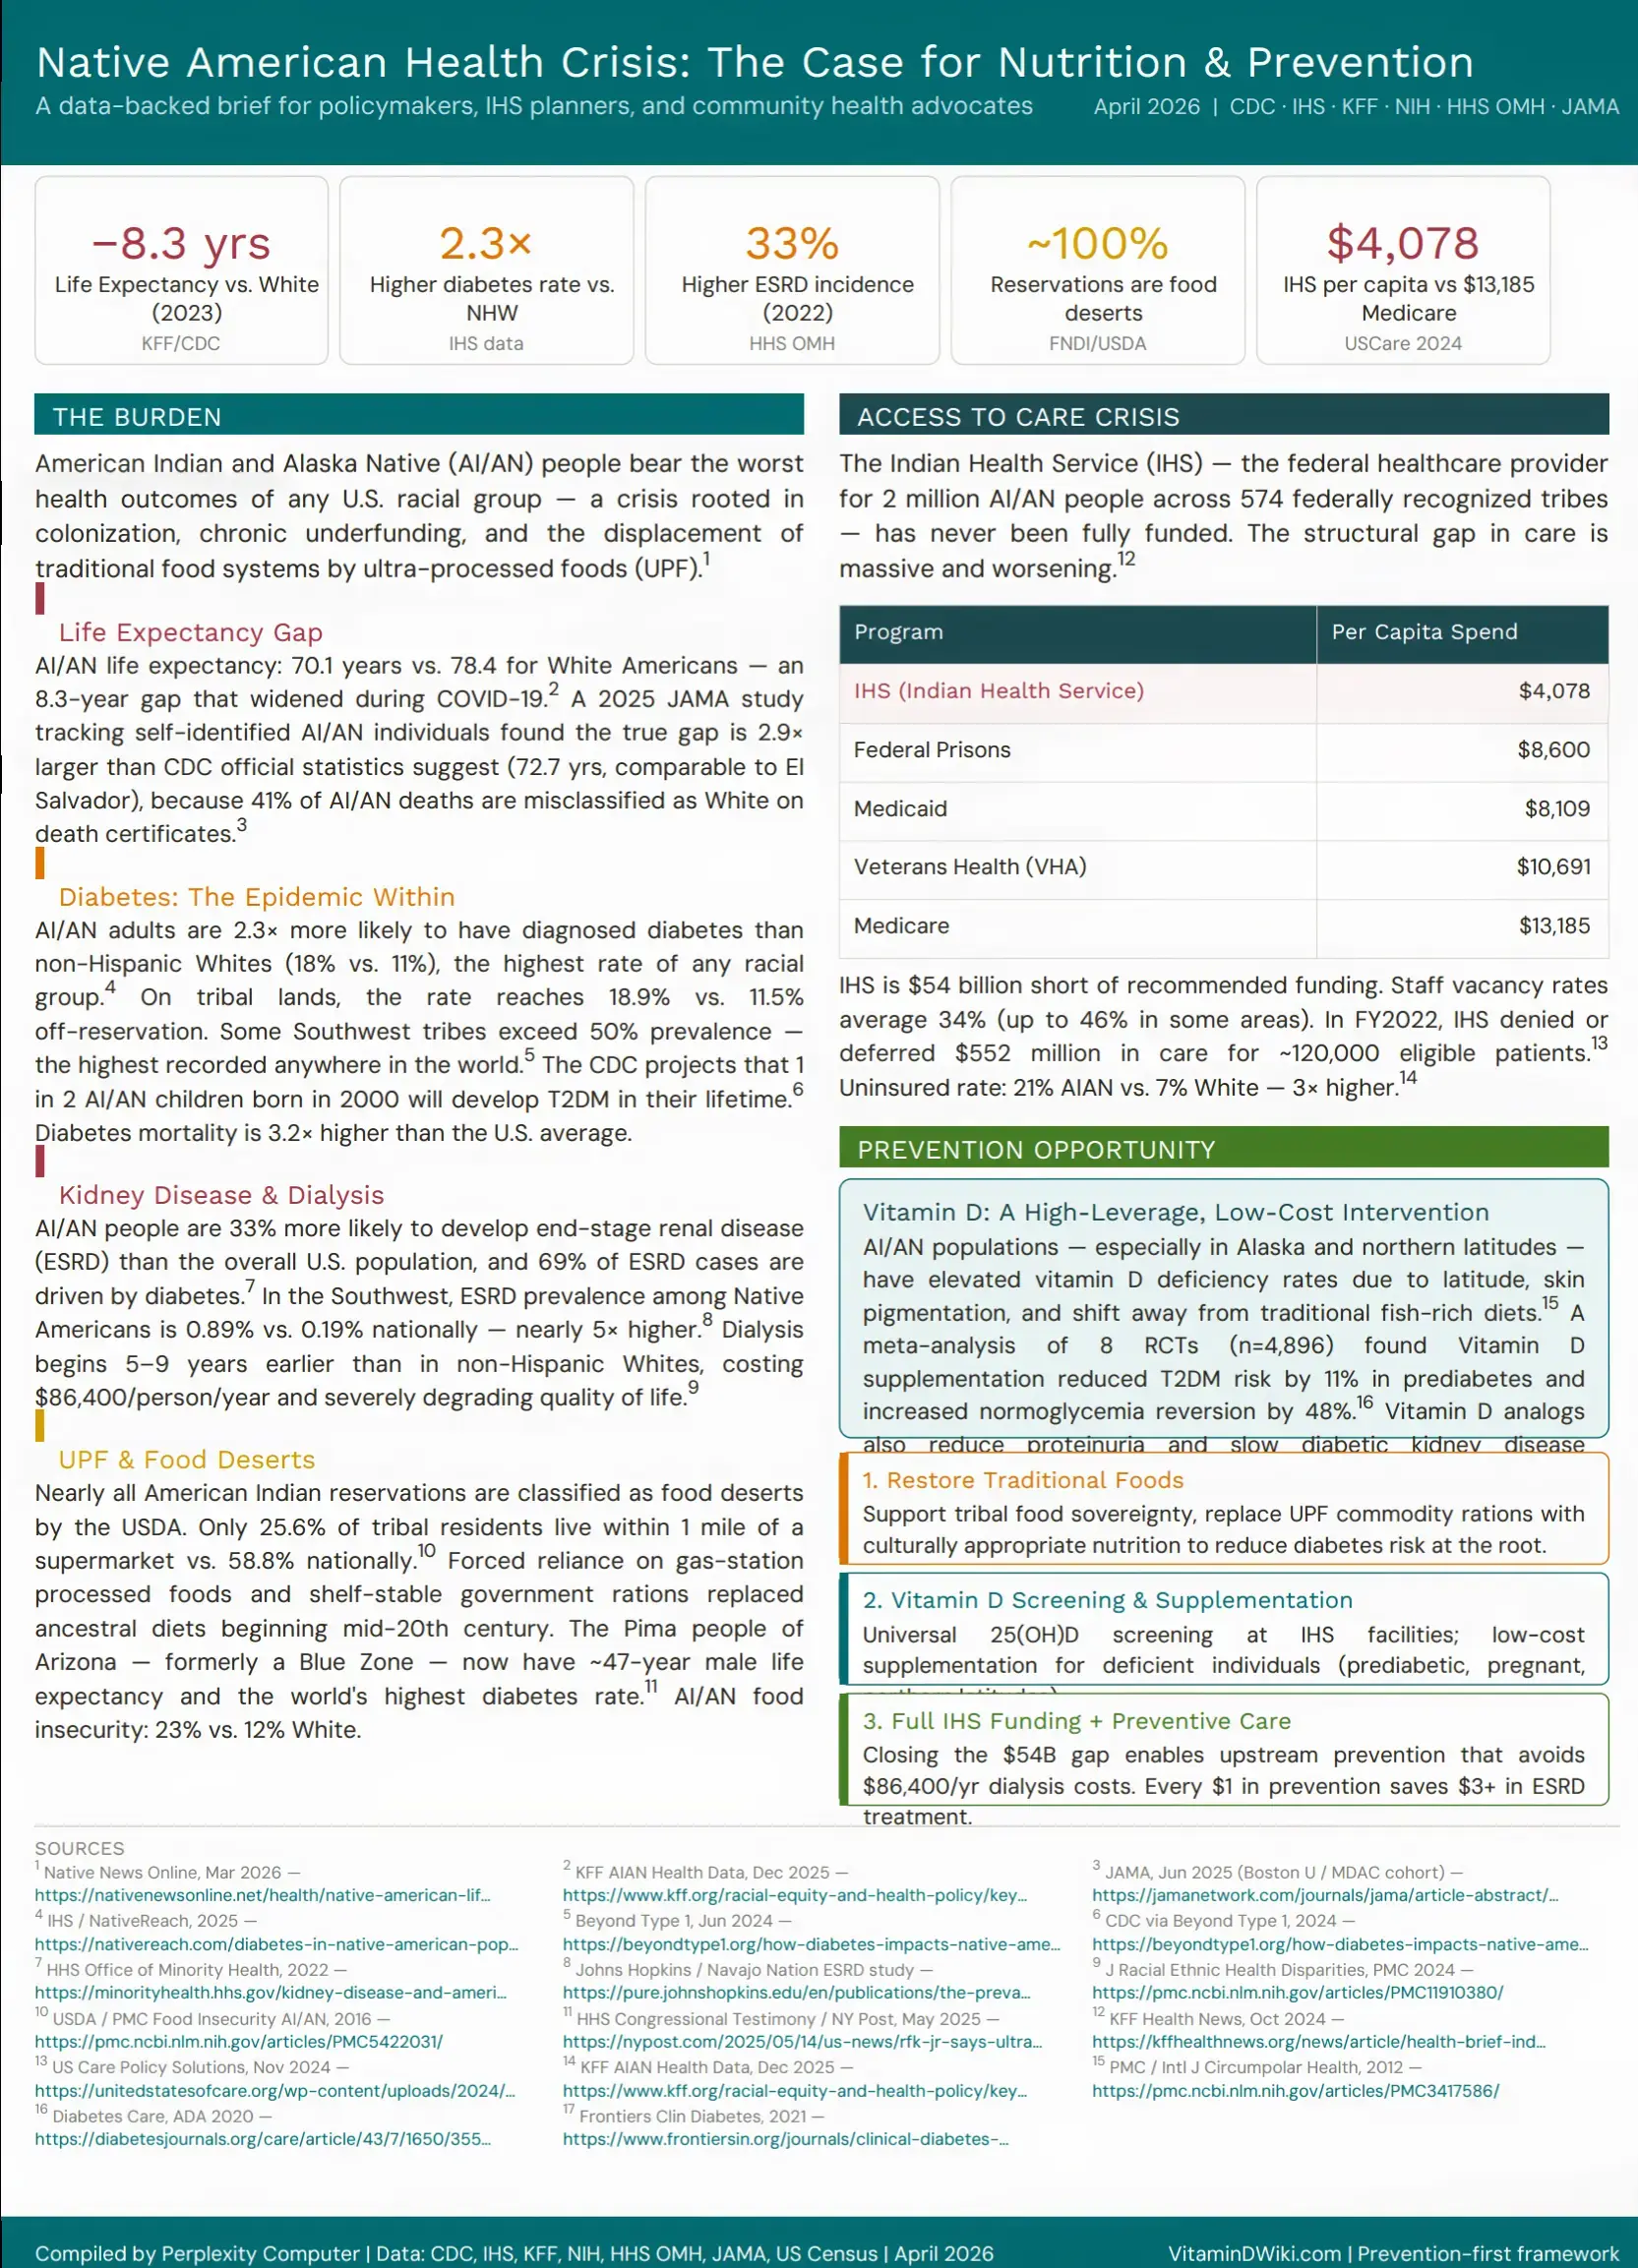
American Indian and Alaska Native (AI/AN) people experience the most severe health disparities of any racial group in the United States — a compound crisis driven by structural underfunding, food system displacement, and social determinants rooted in colonization. This document consolidates the latest data from CDC, Indian Health Service (IHS), NIH, KFF, HHS Office of Minority Health, and the U.S. Census Bureau, with specific attention to where nutrition, vitamin D, and prevention messaging can have the greatest measurable impact.
Summary Statistics Table
| Metric | AI/AN | White / U.S. Avg | Ratio | Source |
|---|---|---|---|---|
| Life expectancy (2023) | 70.1 yrs | 78.4 yrs | −8.3 yrs | KFF 2025 |
| True life expectancy gap (JAMA 2025) | 72.7 yrs | 79.2 yrs | −6.5 yrs (gap 2.9× underreported) | JAMA 2025 |
| Diabetes prevalence (adults) | 18% | 11% | 1.6× | KFF 2025 |
| Diabetes prevalence (on tribal lands) | 18.9% | 11.5% off-reservation | 1.6× | NativeReach 2025 |
| Diabetes mortality rate | 41.5/100k | 19.8/100k | 2.1× | KFF 2025 |
| ESRD incidence (2022) | 508/million | U.S. avg (33% lower) | 1.33× | HHS OMH 2022 |
| ESRD prevalence (SW tribes) | 0.89% | 0.19% national | 4.7× | Johns Hopkins |
| Dialysis onset (vs. NHW) | 5–9 yrs earlier | — | — | PMC11910380 |
| Annual dialysis cost | $86,400/person | — | — | PMC11910380 |
| Food insecurity | 23% | 12% White | 1.9× | KFF 2025 |
| Reservations as food deserts | ~100% | 58.8% within 1 mi of store | — | PMC5422031 |
| Uninsured rate | 21% | 7% White | 3× | KFF 2025 |
| IHS per capita spend | $4,078 | $13,185 (Medicare) | 0.31× | US Care 2024 |
| IHS funding shortfall | $54 billion | — | — | Native News Online 2026 |
| Vit D → T2DM risk reduction | −11% | (in prediabetes) | — | Diabetes Care 2020 |
| Vit D → normoglycemia reversion | +48% | (in prediabetes) | — | Diabetes Care 2020 |
Life Expectancy
15 fewer years than Asian Americans
AI/AN life expectancy in 2023 stands at 70.1 years — 8.3 years less than White Americans (78.4 years) and 15.1 years below Asian Americans (85.2 years), the lowest of any racial group in the U.S. (KFF, December 2025). The gap has widened from 7 years in 2019 to 8.3 years in 2023, primarily due to the disproportionate COVID-19 impact on Native communities.
CDC Undercount Problem (42% of AI/AN deaths are misclassified as white)
Official statistics systematically understate the crisis. A landmark June 2025 JAMA study (Boston University School of Public Health, using the nationally representative MDAC cohort) found that among self-identified AI/AN individuals, life expectancy was only 72.7 years — 6.5 years below the national average. Crucially, the AI/AN vs. U.S. life expectancy gap was 2.9× larger than what CDC WONDER reports, because 41% of AI/AN deaths are misclassified as White on death certificates. When corrected, AI/AN mortality was 42% higher than the national average — not the 5% suggested by official figures (JAMA, June 2025).
Adjusted life expectancy of 72.7 years is comparable to El Salvador and Bangladesh — a stunning indictment of the richest nation on Earth.
Historical Trajectory
| Year | AI/AN Life Expectancy | White Life Expectancy | Gap |
|---|---|---|---|
| 1940 | 51.6 yrs | ~64 yrs | ~12 yrs |
| 2000 | 73.1 yrs | 77.3 yrs | 4.2 yrs |
| 2010 | 73.5 yrs | 78.9 yrs | 5.4 yrs |
| 2019 | 71.8 yrs | 78.8 yrs | 7.0 yrs |
| 2020 | 67.1 yrs | 77.4 yrs | 10.3 yrs |
| 2021 | 65.2 yrs | 76.4 yrs | 11.2 yrs |
| 2023 | 70.1 yrs | 78.4 yrs | 8.3 yrs |
Sources: NCUIH, June 2024; KFF, December 2025
Diabetes (highest rate of any racial group)
Prevalence and Burden - 50+% of some tribes are diabetic
AI/AN adults have the highest diagnosed diabetes rate of any racial group in the U.S.: 18% vs. 11% for White adults (KFF, 2025). The IHS reports AI/AN adults are 2.3× more likely to have been diagnosed with diabetes than non-Hispanic Whites. This represents a 36% higher diagnosis rate than the total U.S. population as of 2024 (NativeReach, November 2025).
Key statistics: - On tribal lands: diabetes prevalence 18.9% vs. 11.5% off-reservation - Some Southwest tribes: prevalence >50% — highest in the world - Diabetes mortality: 3.2× higher than the U.S. all-races average - Children: CDC projects 1 in 2 AI/AN children born in 2000 will develop T2DM in their lifetime (Beyond Type 1, 2024) - 90–98% of all diabetes in AI/AN populations is Type 2 (PMC11910380)
Pima Before: longest living group in North America, Now: Liefspan = 48 years
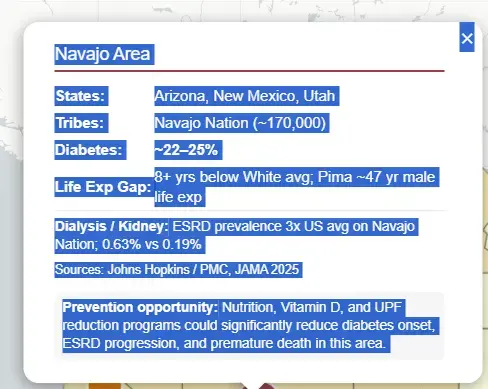
The Tohono O'odham (Pima) people of Arizona were once recognized as a Blue Zone — among the longest-living populations on the continent. Following the diversion of their river water supplies in the early 20th century and replacement of ancestral foods with government-issued processed rations, they now have the world's highest T2DM rate. Male life expectancy in this community is approximately 47 years. Their counterparts across the border in Mexico, who maintained traditional food systems, do not share this burden (HHS Congressional Testimony, May 2025).
Kidney Disease & Dialysis
End-Stage Renal Disease - Incidence and Prevalence
AI/AN people were 33% more likely to be diagnosed with end-stage renal disease (ESRD) than the overall U.S. population in 2022, with an adjusted incidence of 508 cases per million persons (HHS Office of Minority Health, 2022). They were 24% more likely to die of kidney disease.
In the Southwest specifically, ESRD prevalence among Native Americans was 0.89% — 4.7× the national rate of 0.19% and 2.5× higher than the overall Native American national rate of 0.36% (Johns Hopkins/Navajo Nation study).
Diabetes as Driver
69% of ESRD in AI/AN populations is caused by diabetes, compared to 44% in the overall U.S. population (Journal of Racial and Ethnic Health Disparities, PMC 2024). Kidney failure rates are approximately 3.5× higher in AI/AN communities than in Whites (Kidney Cancer Association, 2026).
Dialysis started 5-9 years earlier
AI/AN individuals start dialysis 5–9 years earlier than non-Hispanic Whites across most IHS regions. The cost of ESRD care averages $86,400 per person per year. Earlier dialysis initiation means more cumulative years on dialysis, multiplying both financial and quality-of-life burdens. Additionally, AI/AN Medicare patients with diabetes are 46% less likely than their national counterparts to receive annual urinary microalbumin testing (28.6% vs. national average) — the screening that would catch kidney damage early enough to intervene.
| IHS Region | AI/AN Age at ESRD Onset | NHW Age | Years Earlier (AI/AN) |
|---|---|---|---|
| Region 3 | 61.1 | 68.2 | 7.1 |
| Region 4 | 60.3 | 65.8 | 5.5 |
| Region 5 | 61.9 | 69.1 | 7.2 |
| Region 6 | 58.9 | 68.2 | 9.3 (highest) |
| Region 7 | 61.0 | 67.6 | 6.6 |
| Region 10 | 60.1 | 67.4 | 7.3 |
Source: PMC11910380, JREHD 2024
Ultra-Processed Foods & Food Systems
Food Desert Crisis: both scarce and expensive
Nearly all American Indian reservations are classified as food deserts by the USDA. Only 25.6% of tribal residents live within 1 mile of a supermarket, compared to 58.8% of the U.S. population. Reservation produce availability is not only scarce but more expensive than in non-reservation communities (PMC Food Insecurity study, 2016).
Food Insecurity: 2X higher than whites
From 2000–2010, 25% of AI/ANs were consistently food insecure, double the White rate. Current estimates range from 16–80% depending on region and reservation status, against a 10.5% national baseline. AI/AN food insecurity in 2023: 23% vs. 12% White (KFF, 2025).
Regional food insecurity rates:
- Pacific states: >40%
- Southern Plains / Alaska: >30%
- Montana reservations: 43% in some surveys
- Arizona's Apache County (Navajo, Zuni, Fort Apache): 30%
UPF Displacement of Traditional Diets
Federal commodity food programs historically provided high-calorie, shelf-stable, heavily processed staples (white flour, lard, sugar, canned meats).
These foods replaced nutrient-dense traditional diets of wild game, fish, corn, beans, and squash. The resulting nutritional transition — rich in refined carbohydrates and ultra-processed foods — precisely tracks the trajectory of the diabetes and ESRD epidemics (NEFE, April 2024).
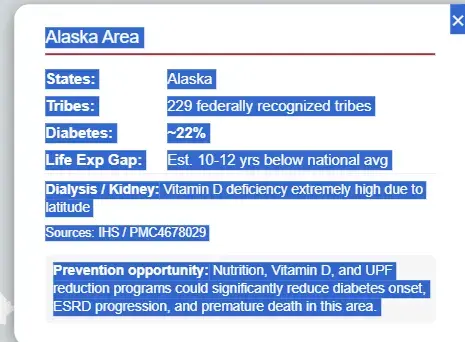
Alaska Native people, who historically consumed diets rich in omega-3 fatty acids and vitamin D from marine mammals and fish, now rely heavily on store-bought foods since the 1950s — a shift that also eliminated a major natural source of vitamin D.
Vitamin D Deficiency
Elevated Risk in AI/AN Populations
Northern AI/AN populations — particularly Alaska Native communities — face elevated vitamin D deficiency rates driven by converging factors: 1. High-latitude geography (limited UVB radiation for synthesis most of the year) 2. Darker skin pigmentation (requires longer sun exposure for equivalent vitamin D synthesis) 3. Abandonment of traditional diets rich in vitamin D (fatty marine fish, marine mammal blubber)
Alaska Native children had rickets-associated hospitalization rates of 2.23 per 100,000 — nearly double the general U.S. rate of 1.23 per 100,000. Rickets incidence increased directly with latitude (PMC4678029). Among Manitoba Amerindian women, 32% of rural and 30.4% of urban women had serum 25(OH)D levels below 37.5 nmol/L — well below the recommended minimum of 75 nmol/L (PMC3417586).
Separately, a study of Native American children at risk for obesity and diabetes found vitamin D insufficiency associated with diabetes risk, a connection not yet well-studied in this population (PubMed 22019791).
Vitamin D and T2DM Prevention
A 2020 meta-analysis of 8 RCTs (n=4,896 participants with prediabetes) published in Diabetes Care found that vitamin D supplementation: - Reduced T2DM incidence by 11% (RR 0.89, 95% CI 0.80–0.99) - Increased reversion from prediabetes to normoglycemia by 48% - Benefits appeared most pronounced in non-obese subjects (Diabetes Care, ADA 2020)
Vitamin D and Diabetic Kidney Disease
Current evidence indicates vitamin D supplementation reduces proteinuria in patients with diabetic kidney disease (DKD), with long-term calcitriol treatment showing greater urinary albumin excretion reduction than short-term treatment. Vitamin D analogs (paricalcitol) have demonstrated reductions in albuminuria and may retard DKD progression (Frontiers, Clinical Diabetes 2021; Therapeutic Advances in Endocrinology, 2025).
Given that AI/AN communities have the highest T2DM rates, begin dialysis 5–9 years earlier, and likely have elevated rates of vitamin D deficiency — targeted screening and supplementation represents a high-leverage, low-cost intervention with strong mechanistic support.
Access to Care
IHS Structural Underfunding
The Indian Health Service provides healthcare for approximately 2 million AI/AN people from 574 federally recognized tribes. Its per capita spending of $4,078 compares to:
| Program | Per Capita Spend |
|---|---|
| IHS | $4,078 |
| Medicaid | $8,109 |
| Federal Prisons | $8,600 |
| Veterans Health (VHA) | $10,691 |
| Medicare | $13,185 |
Source: United States of Care Policy, November 2024
IHS is $54 billion short of recommended full funding. In FY2022, the program denied or deferred nearly $552 million in care for approximately 120,000 eligible patients. Staff vacancy rates average 34% nationally, with some areas exceeding 46% (KFF Health News, October 2024).
Uninsured Rates
AI/AN uninsured rate: 21% vs. 7% White — 3× higher. Only 13% of AI/AN people live on tribal lands, yet that is the primary eligibility criterion for many IHS services. Proposed Medicaid work requirements threaten Medicaid funding that currently accounts for 30–60% of overall funding at many IHS facilities, as Medicaid billed $1.3 billion of $1.8 billion in total third-party IHS collections in FY2025 (KFF, December 2025).
Screening Gaps
- 22% of AI/AN adults have no personal healthcare provider (vs. 16% White)
- 43% have had no dental visit in the past year (vs. 32% White)
- Only 28.6% of AI/AN Medicare diabetics received annual microalbumin testing (vs. national rate), leaving 71.4% without this critical early kidney damage screen
Population Geography & IHS Service Areas
The U.S. AI/AN population totals approximately 7.99 million (2024 Census; includes AIAN alone or in combination). States with the highest AI/AN shares of total population:
| State | AI/AN % of Population | Total AI/AN |
|---|---|---|
| Alaska | 20.35% | 150,191 |
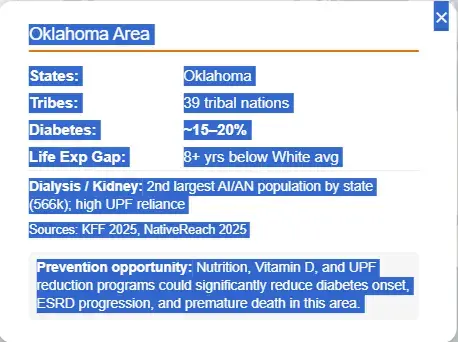
| Oklahoma | 13.65% | 566,147 |
| New Mexico | 12.24% | 260,044 |
| South Dakota | 9.64% | 90,870 |
| Montana | 7.98% | 91,878 |
| North Dakota | 6.27% | 50,516 |
| Arizona | 5.83% | 448,709 |
Source: World Population Review, April 2026
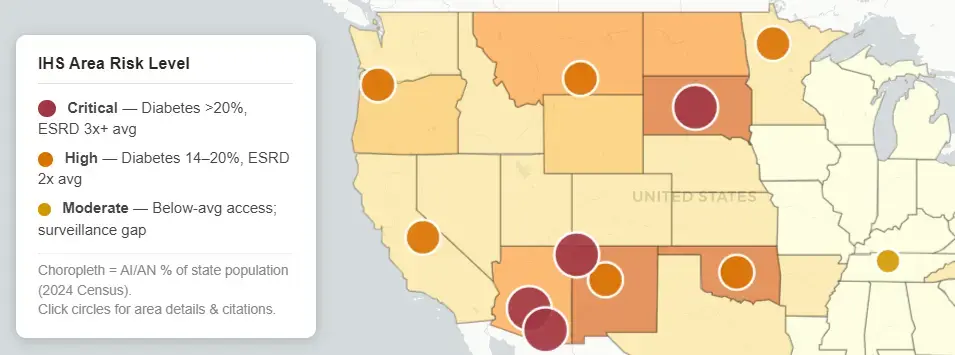
The IHS operates through 12 area offices: Alaska, Albuquerque, Bemidji, Billings, California, Great Plains, Nashville, Navajo, Oklahoma, Phoenix, Portland, and Tucson. The highest burden areas for chronic disease prevention messaging are:
- Navajo / Tucson / Phoenix: ESRD prevalence 3–5× national average; SW tribe diabetes >50%; Pima crisis
- Great Plains (SD, ND, NE): Dialysis onset 7–9 years earlier than NHW; food insecurity >30%
- Alaska: Highest vitamin D deficiency; rickets double national rate; COVID mortality highest in U.S.
- Oklahoma: 2nd-largest AI/AN state population (566k); 39 tribal nations; high UPF reliance
Prevention Messaging Framework
The Core Argument: US policy ==> chronic health problems
The AI/AN chronic disease crisis is not genetically determined — it is the result of a deliberate policy environment: food system destruction, UPF imposition, vitamin D depletion, and systematic healthcare underfunding. The Pima case (Mexico vs. Arizona) provides the clearest natural experiment: the same genetics, radically different outcomes based solely on diet and food sovereignty. This frames prevention not as individual behavior change but as structural restoration.
High-Leverage Interventions
1. Universal Vitamin D Screening at IHS Cost: ~$25–$30 per 25(OH)D test. Identification of deficient individuals (especially prediabetic, pregnant, or northern-latitude populations) followed by supplementation addresses a modifiable risk factor with evidence for: - 11% reduction in T2DM conversion from prediabetes - 48% increased normoglycemia reversion - Reduced proteinuria in DKD - Improved immune function (COVID vulnerability reduction)
2. Food Sovereignty & UPF Reduction Tribal food sovereignty programs that replace commodity UPF rations with traditional foods address the metabolic root cause. Every dollar invested in food sovereignty reduces downstream dialysis costs ($86,400/patient/year). Cultural framing resonates more powerfully than generic nutrition messaging.
3. IHS Full Funding Advocacy The current $4,078 per-capita IHS spend — less than incarceration health spend — makes preventive screening and supplementation impossible at scale. The economic case: preventing one case of ESRD saves approximately $86,400/year indefinitely. Prevention ROI in this population is exceptionally high given the scale of prediabetes and early-stage DKD.
4. Targeted Messaging by IHS Region Prevention messaging should be calibrated to regional burden: - Alaska: Vitamin D + traditional diet restoration (fish, marine mammals) - Southwest (Navajo, Tucson, Phoenix): Diabetes reversal, UPF displacement, food sovereignty - Great Plains: ESRD/dialysis prevention, microalbumin screening - Oklahoma/California: Urban AI/AN populations; food desert access; uninsured rate interventions
1 page brief
Map of Native American health problems