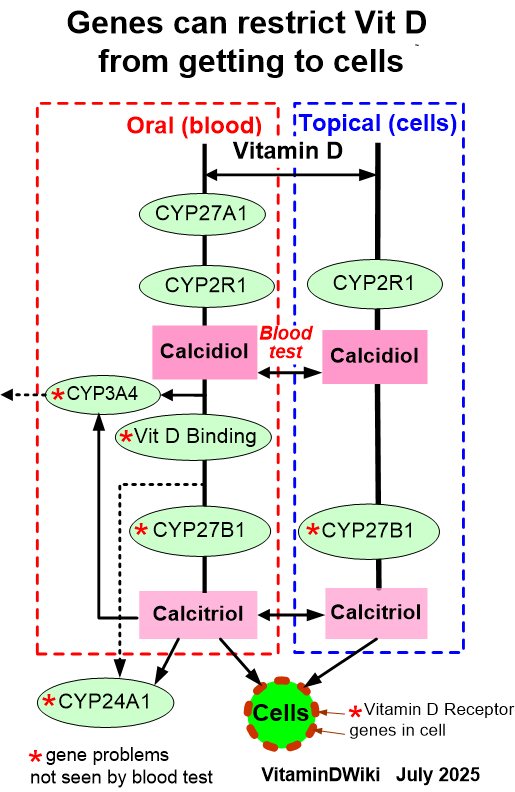
Vitamin D levels in cells can be half as much as in blood, sometimes 2X more than blood
Vitamin D Metabolites by Body Compartment: Which Exceed 2× Blood, and Which Fall Below Half of Blood
Claude AI Sept 2026
TL;DR
- Only a handful of compartments genuinely exceed 2× the blood concentration, and almost all do so for a specific metabolite for a specific mechanistic reason: gingival crevicular fluid (25(OH)D3, ~305×, near-certain assay artifact), tuberculous pleural fluid (FREE 1,25(OH)2D, 5.3×, local macrophage synthesis), sarcoid/granuloma tissue (1,25(OH)2D, local synthesis), and lipid-rich animal stores for the PARENT vitamin D3 (adipose, egg yolk, fatty-fish flesh/liver).
- A much larger group sits at ≤0.5× blood, driven by low binding-protein content: amniotic fluid, saliva, breast milk/colostrum, cerebrospinal fluid and brain tissue, synovial fluid, peritoneal dialysate, cord-blood 1,25(OH)2D, and urine.
- Many "famous" compartments are actually unremarkable (0.5–2×): cord-blood 25(OH)D, follicular fluid, seminal plasma, tears, non-tuberculous pleural effusion, aqueous humor — and several widely-assumed compartments (skin parent D3 per gram, sweat, hair/nails, lymph, tumor tissue, biliary concentration, middle-ear/sinus fluid) have NO verifiable same-subject paired measurement at all.
Key Findings
The single most important organizing principle is that total metabolite concentration in any fluid is governed by that fluid's vitamin D–binding protein (DBP) and albumin content, because only a tiny free fraction circulates unbound. Per the Bouillon/Bikle free-hormone literature, "approximately 0.4% of total 1,25(OH)2D3 and 0.03% of total 25OHD3 are free in serum from normal non-pregnant individuals," with ~85% bound to DBP and ~15% to albumin [Bikle/Bouillon free hormone]. So compartments derived by ultrafiltration (CSF, aqueous/vitreous humor, saliva, milk, amniotic fluid) are protein-poor and therefore low in TOTAL metabolite even when FREE metabolite may be normal. Two things can push a compartment ABOVE blood:
- (1) local CYP27B1 synthesis of 1,25(OH)2D (activated macrophages in granulomata/TB/sarcoid, and the placenta), which raises FREE 1,25(OH)2D locally, and
- (2) lipid partitioning of the parent vitamin D3, which concentrates in fat depots and fatty tissues. The notorious gingival-crevicular-fluid result is best treated as a methodological artifact, not biology.
Details
(A) Compartments ≥2× HIGHER than blood (Gums, TB, fat, chicken egg yoke, ...)
Gingival crevicular fluid (GCF) Metabolite: 25(OH)D3 (total) Local value: median 8,946.80 nmol/L Blood value: plasma median 29.28 nmol/L Ratio: ~305× Assay: radioimmunoassay (RIA) n / disease: 19 GCF / 12 plasma; aggressive (inflamed) periodontitis Source: Liu K, Meng H, Lu R et al., J Periodontol 2010;81(2):260–266 [Liu 2010 PMID 20151805]. Interpretation: almost certainly an assay artifact (RIA on a tiny protein-rich inflammatory exudate; never replicated by LC-MS/MS). A companion group showed GCF DBP is actually LOWER than plasma in periodontitis [Zhang 2014 DBP in GCF], which makes a genuine 300-fold TOTAL 25(OH)D excess biochemically implausible.
Tuberculous pleural fluid Metabolite: 1,25(OH)2D — TOTAL modestly higher, FREE markedly higher Local value: total 1,25(OH)2D 67 pg/mL; FREE fraction 5.3× serum Blood value: total serum 1,25(OH)2D 35 pg/mL Ratio: total ~1.9×; FREE 5.3× (NOTE: total 25(OH)D is LOWER in fluid than serum) Assay: binding assay after chromatography n / disease: tuberculous pleuritis (local macrophage CYP27B1 activity) Source: Barnes PF, Modlin RL, Bikle DD, Adams JS, J Clin Invest 1989;83(5):1527–1532 — "mean concentrations of total 1,25-(OH)2-D were elevated in pleural fluid, compared to blood (67 pg/ml vs. 35 pg/ml)… The mean free 1,25-(OH)2-D concentration in pleural fluid was increased 5.3-fold over that in serum" [Barnes 1989 doi:10.1172/JCI114048]. Mechanism confirmed by demonstration that granulomatous/alveolar macrophages synthesize 1,25(OH)2D3 from 25(OH)D3 [Adams 1983 JCI].
Sarcoid granuloma / pulmonary alveolar macrophages (local 1,25(OH)2D synthesis) Metabolite: 1,25(OH)2D3 Local value: actively synthesized in situ; 1α-hydroxylase mRNA ~5× higher in sarcoid BAL cells than controls (10.8 ± 3.6 vs 2.2 ± 1.4) Blood value: serum 1,25(OH)2D (often high-normal/elevated) Ratio: not a clean fluid:serum number, but macrophages are a net 1,25(OH)2D SOURCE Assay: HPLC / PCR for CYP27B1; cultured-cell radiotracer n / disease: sarcoidosis (granulomatous, inflamed) Source: Adams JS et al., J Clin Invest 1983;72:1856–1860 [Adams 1983]; Reichel H, Koeffler HP, Barbers R, Norman AW, J Clin Endocrinol Metab 1987;65(6):1201–1209 — cultured alveolar macrophages from active pulmonary sarcoidosis constitutively express a 25(OH)D3-1-hydroxylation reaction in vitro [Reichel 1987 PMID 3119653]; BAL 1α-hydroxylase mRNA ~5× controls [Inui 2001 PMID 11403752]. Caveat: raw bronchoalveolar-lavage (BAL) fluid is saline-diluted and cannot be compared to serum without urea correction — the elevation is at the cellular/tissue level, not necessarily in dilute BAL supernatant.
Adipose tissue — PARENT vitamin D3 only Metabolite: vitamin D3 (cholecalciferol, parent) Local value: greater than in muscle or liver; fat is the major body store of parent D3 Blood value: serum vitamin D3 (typically very low/near-undetectable; e.g. median maternal plasma parent vitamin D "not detectable, range nd–40 nmol/L") Ratio: parent D3 per gram fat exceeds circulating parent D3 (lipid partitioning); UNIT-INCOMMENSURABLE (ng/g tissue vs nmol/L plasma) Assay: LC-MS/MS n / disease: rat and human tissue-distribution studies Source: Lipkie/Ferruzzi soft-tissue LC-MS/MS, J Chromatogr B 2013 [Lipkie 2013]; low circulating parent D3 confirmed [Keitel-Gröner PMID 30526692]. CAVEAT: for the METABOLITE 25(OH)D, adipose is LOWER per unit mass than serum (~5.8 nmol/kg subcutaneous white adipose; Piccolo/Beckman 2013 [PMID 24067385]) — see section B. Adipose is a large TOTAL store but a low-CONCENTRATION one for 25(OH)D.
Egg yolk — animal deposition store (PARENT D3) Metabolite: vitamin D3 (and 25(OH)D3) Local value: commercial yolk ~4.0–4.9 µg vitamin D3/100 g (≈40–49 ng/g) and ~1.0–1.3 µg 25-OH-D3/100 g (≈10–13 ng/g) Blood value: laying-hen plasma D3/25-OH-D3 Ratio: yolk parent D3 concentration exceeds hen plasma parent D3 (fat-soluble deposition); UNIT-INCOMMENSURABLE Assay: LC-MS/MS n / disease: laying hens (healthy, dietary studies) Source: J Agric Food Chem 2011 [Schmid/Walther 2011]; dose-response in hens [bioRxiv 2021].
Fatty-fish flesh and liver — animal store (PARENT D3) Metabolite: vitamin D3 Local value: farmed Atlantic salmon fillet ~24–227 ng/g; fish store large quantities in liver and fat Blood value: fish plasma D3 Ratio: tissue parent D3 >> plasma parent D3; UNIT-INCOMMENSURABLE Assay: LC-MS/MS n / disease: farmed salmon / rainbow trout feeding trials Source: Keitel-Gröner et al., Aquaculture Nutrition 2026 [salmon 2026]; salmon muscle vitamin D3 24–227 ng/g, 25(OH)D3 <1 ng/g [Sci Rep 2025]. Note 25(OH)D3 in flesh is very low (<1 ng/g) — only the PARENT accumulates.
(B) Compartments ≤0.5× (half or less of) blood (Amniotic, Cord, Saliva, Breast milk...)
Amniotic fluid Metabolite: 25(OH)D3 / 24,25(OH)2D3 / 1,25(OH)2D3 Local value: 0.732 ng/mL / 0.212 ng/mL / 14.3 pg/mL Blood value (maternal serum): 18.03 ng/mL / 1.473 ng/mL / 36 pg/mL Ratio: 0.04× / 0.14× / 0.40× (all well below 0.5×) Assay: competitive binding after chromatography n / disease: 26 term elective cesarean, normal pregnancy Source: amniotic-fluid/maternal/fetal study, term pregnancies [amniotic 1987 PMID 3501463]. Amniotic 25(OH)D is also lower in diabetic pregnancy [PMID 3956825].
Cord blood — 1,25(OH)2D only Metabolite: 1,25(OH)2D Local value: cord 37.3 pg/mL Blood value: maternal serum 90.1 pg/mL Ratio: 0.41× Assay: binding assay of D2+D3 forms n / disease: 10 mothers, term delivery, D2-supplemented Source: maternal/cord serum study [cord D2/D3 serum]; corroborated by NEJM 1980 showing placental-vein 1,25(OH)2D far below maternal/adult [NEJM 1980]. Conflict: one term study found cord 1,25 = 29.2 vs maternal 36 pg/mL (0.81×, NS) [PMID 3501463], so cord 1,25(OH)2D is variable and only sometimes <0.5×.
Saliva Metabolite: 25(OH)D (total) Local value: ~1.2% of serum Blood value: serum 25(OH)D Ratio: ~0.012× (≈80× lower) Assay: competitive protein binding n / disease: healthy adults Source: Fairney A et al. 1987 [PMID 3801379]. Reason: saliva is protein-poor (little DBP).
Breast milk (mature) and colostrum Metabolite: 25(OH)D and parent vitamin D Local value: colostrum 25-OH-D ~294 pg/mL rising to mature-milk ~845 pg/mL; parent vitamin D colostrum ~122 pg/mL, mature ~38 pg/mL; total antirachitic activity ~50–80 IU/L (a 2023 meta-analysis gives mean 58 IU/L, 95% CI 45–70, mostly 25OHD3) Blood value: maternal serum Ratio: per NIH LactMed, "milk levels of vitamin D and 25-OH-vitamin D are 10 to 20% and 1 to 2% of maternal blood levels, respectively" — i.e. 25(OH)D ≈0.01–0.02× maternal serum Assay: protein binding after HPLC n / disease: lactating women (healthy) Source: lactation-stage HPLC study [milk stages PMID 6548730]; [LactMed NBK500914]; breast-milk antirachitic activity meta-analysis [PMID 37264448].
Cerebrospinal fluid and brain tissue Metabolite: 25(OH)D3 Local value: CSF tracks the albumin ratio (far below serum); rat brain 25(OH)D3 128–175 pg/g Blood value: serum 25(OH)D3 Ratio: CSF and brain ~0.01× (≈1/100 of serum in rat brain) Assay: LC-MS / LC-ESI-MS/MS n / disease: CSF human (Holmøy 2009); rat brain n=6 Source: Holmøy T et al. 2009 [PMID 19808741]; rat-brain LC-MS/MS [brain 25(OH)D3]. One human outlier reported CSF ~1.4× serum (Lee et al. PLoS One 2019), but the weight of evidence is that CNS compartments are far below blood.
Synovial fluid Metabolite: all metabolites (25(OH)D3, 24,25(OH)2D3, 1,25(OH)2D3) Local value: significantly LOWER than paired serum; 1,25(OH)2D3 unquantifiable in 13/20 rheumatoid samples Blood value: paired serum Ratio: <1× for all; 1,25(OH)2D3 often below detection Assay: LC-MS/MS n / disease: 20 rheumatoid arthritis (inflamed joint) Source: Li D, Jeffery LE, Jenkinson C, Chun RF, Adams JS, Raza K, Hewison M, J Steroid Biochem Mol Biol 2019;187:1–8 [Li 2019 PMID 30611909].
Peritoneal dialysate effluent Metabolite: 25(OH)D3 Local value: 2.3 ± 0.9 nmol/L (many <1.0) Blood value: serum 29.1 ± 22.9 nmol/L Ratio: ~0.08× Assay: binding assay; DBP measured (dialysate 0.24 vs serum 5.9 µmol/L) n / disease: 14 CAPD patients Source: CAPD kinetics study [PMID 2488382]. CAVEAT: dialysate is diluted by ~2 L instilled fluid — raw concentration is not comparable to serum without a dilution/mass-transfer correction; the point estimate confirms only trace transfer. Peritonitis can add local macrophage 1,25(OH)2D synthesis (Hayes 1987, FEBS Lett).
Urine Metabolite: 25(OH)D (unconjugated) Local value: healthy excretion ~0.17 nmol/day; nephrotic 0.27–10 nmol/day Blood value: serum 25(OH)D (nmol/L) Ratio: urinary concentration far below serum in health; rises with proteinuria but remains a loss route, not a concentrated pool Assay: competitive binding; LC-MS/MS available n / disease: healthy vs nephrotic syndrome Source: urinary 25(OH)D in health and nephrosis [PMID 6977006]; LC-MS/MS urine assay [PMID 26602143]. Mechanism: 25(OH)D is lost as the 25(OH)D–DBP complex when megalin reabsorption fails.
Liver and skeletal-muscle tissue (metabolite 25(OH)D3)
Metabolite: 25(OH)D3 Local value: pig liver mostly undetectable (one sample 1.69 ng/g); muscle ~0.84 ng/g Blood value: serum 25(OH)D3 (ng/mL) Ratio: <0.5× per unit mass for 25(OH)D3; UNIT-INCOMMENSURABLE Assay: LC-MS/MS / HPLC-MS n / disease: pigs (healthy) Source: hypovitaminosis-D pig model [Br J Nutr pig]; swine tissue HPLC-MS (with 25-OH-D3 feeding: skin 24.8, kidney 14.2, liver/muscle 5.7 ng/g) [PMID 20299291].
(C) Compartments roughly comparable to blood (0.5×–2×) — checked and unremarkable
Cord blood — 25(OH)D: ~0.6–0.8× maternal serum (cord 19.77 vs maternal ~26–36 ng/mL) — does NOT reach the 0.5× threshold [Shanghai cohort]; cord 20.1 vs maternal 30.7 ng/mL = 0.65× [serum D2/D3].
Follicular fluid (ovarian): 25(OH)D tightly correlated with serum (r=0.769), roughly equal; 24,25(OH)2D3 slightly higher than serum and 1,25(OH)2D3 slightly lower (local conversion) — but not 2× either way [FF 24,25 study PMID 40245991]; [Anifandis 2010].
Seminal plasma: 25(OH)D present and correlated with serum, same order of magnitude [semen LC-MS/MS].
Tears: 25(OH)D 17.0 vs serum 9.4 ng/mL (~1.9×) — borderline, does not reach 2× (Sethu S et al., Eye Vis 2016;3:22).
Pleural effusion (non-tuberculous, malignant/benign): 25(OH)D ~1.4× serum — below 2× [Duffy 2016 PMID 27502152].
Aqueous humor: 25(OH)D uncorrelated with serum, disease-dependent; in glaucoma/cataract series aqueous is of the same order as, or lower than, serum [aqueous cataract], [aqueous glaucoma reduced].
Bile: enterohepatic recycling exists, but <4% of biliary metabolite is 25(OH)D and there is no clean concentration ratio showing biliary 25(OH)D exceeds serum [reappraisal PMID 6145834], [Arnaud 1975 PMID 1153436].
(D) Compartments with NO verifiable same-subject paired measurement
- Skin/epidermis PARENT vitamin D3 per gram vs serum: No study reports cholecalciferol tissue concentration (ng/g) in human skin after UVB paired with serum. Human skin biopsies quantify the PRECURSOR 7-dehydrocholesterol (~0.22–0.25 µg/mg) — NOT vitamin D3 [Borecka/Rhodes 2024 Nutrients]. The only "skin vitamin D3 content" figure is a per-cm² review estimate (up to ~25 ng/cm² at ~1.3% conversion) [Lehmann Exp Dermatol 2009], not a per-gram concentration, so a rigorous skin:blood D3 ratio cannot be computed. Biologically, epidermal parent D3 immediately after UVB almost certainly exceeds the very low serum parent D3 (baseline ~1.5 ± 1.5 nmol/L, rising a few nmol/L post-UVR per Borecka/Rhodes 2024), but this is not documented as a measured ratio.
- Tumor tissue vs adjacent normal vs serum (breast/colon/prostate): studies measure serum 25(OH)D and tumor CYP27B1/VDR expression, not tissue metabolite concentration; no clean paired tissue:serum concentration ratio published [breast plasma 25(OH)D & 1,25].
- Sweat; hair; nails: no verifiable vitamin D metabolite concentration measurement located.
- Lymph / thoracic-duct lymph: only protein/DBP content is described (lymph protein ~50–75% of plasma; rat mesenteric lymph carries D3/25(OH)D3 on DBP) — no human paired metabolite concentration [lymph DBP rat].
- Vitreous humor: vitamin D reported reduced in proliferative-diabetic-retinopathy vitreous, but no clean paired vitreous:serum concentration ratio published [vitreous/DR review].
- Middle-ear fluid; sinus fluid; tonsil tissue; wound/blister/interstitial fluid: no verifiable paired vitamin D metabolite measurement located.
- Human bone tissue: no verifiable per-gram bone 25(OH)D concentration paired with serum located.
Recommendations
- Treat the GCF 305× result as an artifact unless and until it is replicated by LC-MS/MS with reported DBP content of GCF. The threshold that would change this: an LC-MS/MS study on paired GCF/serum showing >2× TOTAL 25(OH)D with GCF DBP measured.
- Report the metabolite and the fraction (total vs free) every time. The only robust ">2×" biology is (a) FREE 1,25(OH)2D in granulomatous fluids/tissue via local CYP27B1, and (b) PARENT vitamin D3 in fat/egg yolk/fatty fish. Present these two mechanisms separately; do not merge them into a single "compartment" claim.
- Flag unit-incommensurability explicitly for every tissue (ng/g) vs fluid (nmol/L) comparison and every diluted sample (BAL, peritoneal dialysate). Do not compute a "ratio" across incommensurable units without stating the assumption.
- For the "below half" list, lead with the binding-protein explanation (CSF, saliva, milk, amniotic fluid, aqueous humor) so readers understand these are low-TOTAL, potentially normal-FREE compartments.
- Prioritise three genuine literature gaps if commissioning new measurement: (i) paired human skin-biopsy parent D3 (ng/g) vs serum after UVB; (ii) paired tumor vs adjacent-normal vs serum tissue metabolite concentrations by LC-MS/MS; (iii) any wound/blister-fluid vitamin D metabolite with paired serum and DBP.
General principle (which compartments should be high or low)
Expect a compartment to exceed blood only when it either
- (1) contains cells actively making 1,25(OH)2D through CYP27B1 — activated macrophages in granulomas (TB pleuritis, sarcoidosis, peritonitis) and the placenta — which raises the FREE active hormone locally, or *(2) is a lipid-rich store into which the fat-soluble PARENT vitamin D3 partitions (adipose tissue, egg yolk, fatty-fish flesh and liver).
Expect a compartment to fall below half of blood whenever it is a protein-poor ultrafiltrate, because total 25(OH)D and 1,25(OH)2D track their carrier proteins: CSF, saliva, tears, aqueous/vitreous humor, milk, amniotic fluid, and dialysate all have little DBP/albumin and therefore little TOTAL metabolite — even though FREE metabolite in them may be near-normal.
Fluids formed by protein loss (urine, peritoneal dialysate) carry 25(OH)D only insofar as they carry DBP. Against this framework, a reported ratio is biologically plausible if it is a FREE 1,25(OH)2D elevation at an inflammatory/granulomatous site, or a PARENT-D3 elevation in fat; it is implausible (and should be suspected as assay artifact) if it claims a several-hundred-fold TOTAL 25(OH)D excess in a small, DBP-poor inflammatory exudate — exactly the GCF situation.
Caveats
- Several key values come from older RIA/competitive-binding assays (GCF, saliva, amniotic fluid, milk, TB pleural fluid) that predate LC-MS/MS standardization and may misread total metabolite because of incomplete DBP dissociation or cross-reactivity.
- Disease state matters: many high-ratio compartments are inflamed (periodontitis GCF, TB pleura, sarcoid, peritonitis), where local immune synthesis or protein exudation changes the picture versus health.
- Free vs total was measurable in only a few studies (notably TB pleural fluid); most "below-half" total values could conceal a normal FREE metabolite.
- Cord-blood 1,25(OH)2D and amniotic 1,25(OH)2D values conflict between studies; both directions are flagged rather than forcing a single number.
- Tissue distribution data for liver/muscle/kidney/skin come largely from pigs, rats, and fish; direct human autopsy per-gram metabolite concentrations paired with serum are sparse, so cross-species inference is required and noted as such.
Related in VitaminDWiki
- Changes during pregnancy of vitamin D (decrease), DBP (2X) and albumin (0.8X)
- Preeclampsia 11X more likely if poor Vitamin D Binding Protein (South Africa)
- Poor Vitamin D Binding Protein Genes increase the risk of various diseases
- Another gene which limits Vitamin D is found to increase COVID-19 (Binding Protein in this case)
- Vitamin D Binding Protein Review
- Vitamin D stored in muscle via Vitamin D Binding Protein
- Vitamin D Binding Protein masks how much Vitamin D gets to tissues
- Poor Vitamin D response 4X more likely if poor Vitamin D binding proteins
- Vitamin D - Binding Protein, Receptor, enzymes and health benefits - review
- Vitamin D Binding Protein and Coronary artery disease
- Genetics Binding Protein (GC) can restrict D to cells, but is invisible to standard Vitamin D tests