Overview Vitamin D Dose-Response
Need 9600 IU Vitamin D to get most people to 40 ng – with graph Feb 2011
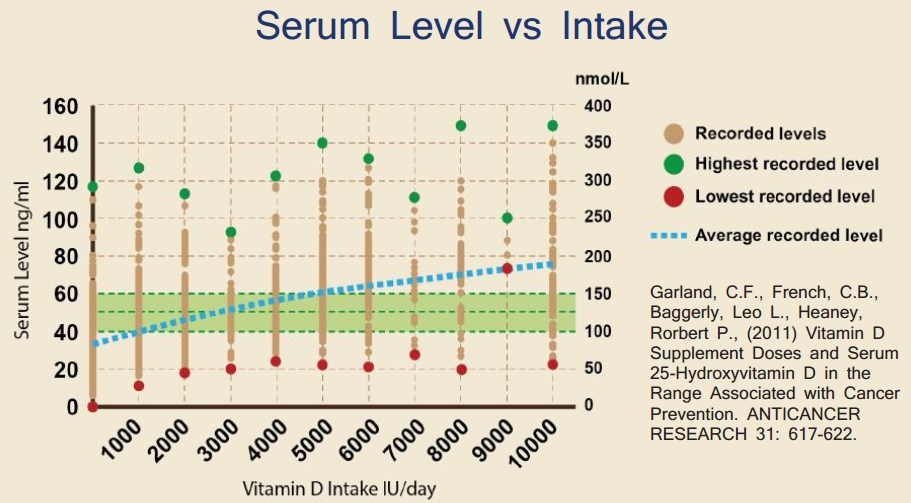
Vitamin D Supplement Doses and Serum 25-Hydroxyvitamin D in the Range Associated with Cancer Prevention
CEDRIC F. GARLAND 1, CHRISTINE B. FRENCH 2, LEO L. BAGGERLY 2 and ROBERT P. HEANEY 3
1 University of California, San Diego, 9500 Gilman Drive, La Jolla, CA 92093, U.S.A.;
2 GrassrootsHealth, P.O. Box 234208, Encinitas, CA 92023, U.S.A.;
3 Creighton University, 2500 California Plaza, Omaha, NE 68178, U.S.A.
Background: Studies indicate that intake of vitamin D in the range from 1,100 to 4,000 IU/d and a serum 25- hydroxyvitamin D concentration [25(OH)D] from 60-80 ng/ml may be needed to reduce cancer risk. Few community-based studies allow estimation of the dose-response relationship between oral intake of vitamin D and corresponding serum 25(OH)D in the range above 1,000 IU/d.
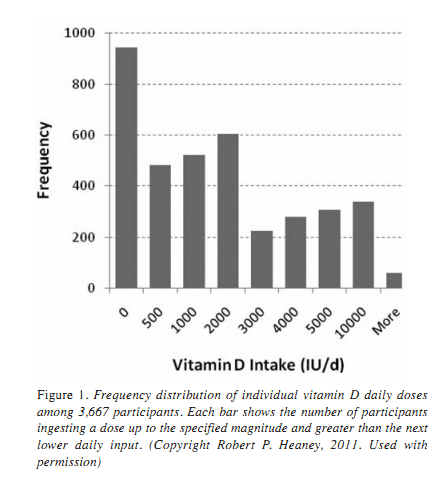
Materials and Methods: A descriptive study of serum 25(OH)D concentration and self-reported vitamin D intake in a community-based cohort (n=3,667, mean age 51.3 ±13.4 y).
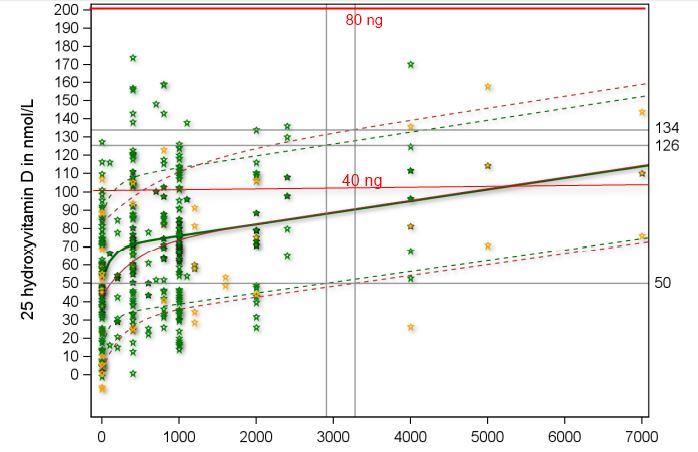
Results: Serum 25(OH)D rose as a function of self-reported vitamin D supplement ingestion in a curvilinear fashion, with no intakes of 10,000 IU/d or lower producing 25(OH)D values above the lower-bound of the zone of potential toxicity (200 ng/ml). Unsupplemented all-source input was estimated at 3,300 IU/d.
The supplemental dose ensuring that 97.5% of this population achieved a serum 25(OH)D of at least 40 ng/ml was 9,600 IU/d.
Need 14,100 IU/d to get 97.5% of the population above 50 ng/ml
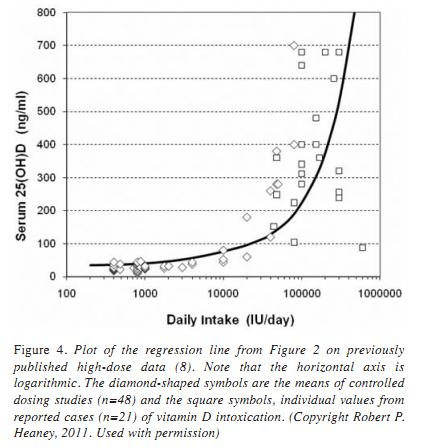
Conclusion: Universal intake of up to 40,000 IU vitamin D per day is unlikely to result in vitamin D toxicity
Dose-response graph from the paper
Note: no apparent data below 33 ng and calculation does NOT account for skin color, BMI, latitude, age, co-factors, state of health, etc.
[tiki-download_file.php?fileId=1667] for PDF
Other interesting graphs in the paper include
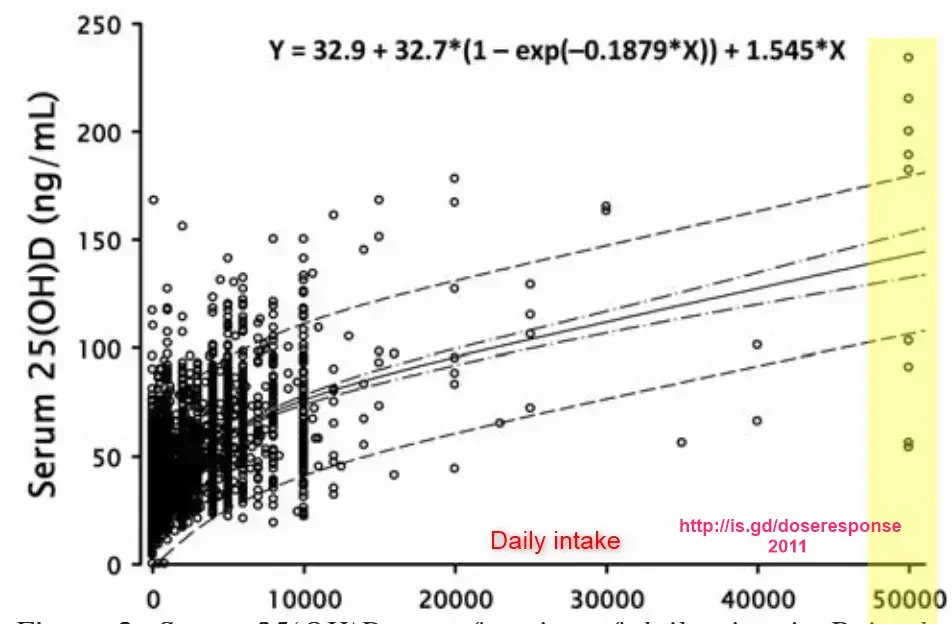
Note: None of the responses to 50,000 IU are within the 97% range of the equation.
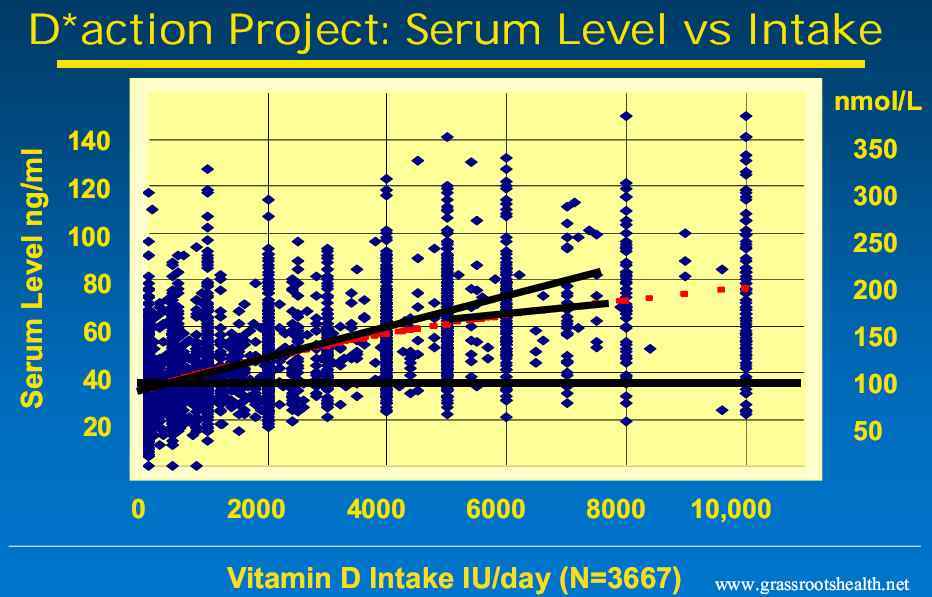
Huge variation in response to each dose (Chart of data by GrassrootsHealth)
Half of seniors did not respond to 1600 IU of vitamin D daily for a year
RED square = reduction in serum level

from slide presentation: https://www.VitaminDWiki.com/tiki-index.php?page_id=2269
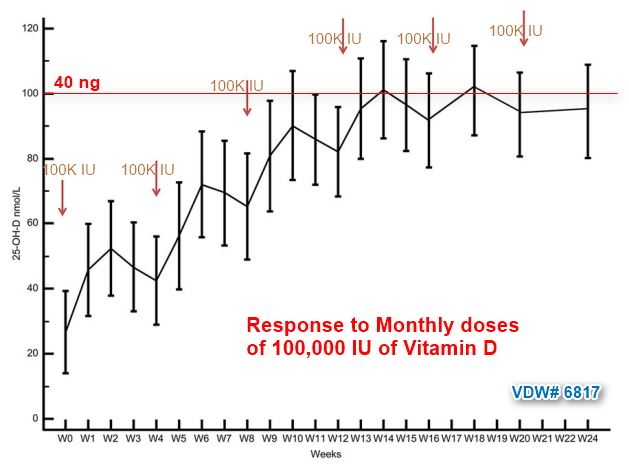
Graph of weekly response to monthly vitamin D supplementation – Aug 2015
See also VitaminDWiki
Response to Vitamin D - many studies 190+ as of Aug 2024
Dietary fat increased Vitamin D response by 32% – RCT Feb 2015
Response to Vitamin D varied by 12 ng due to gene variants (CYP2R1) – Aug 2019
10 reasons for poor response to Vitamin D (race, binding protein, etc.) – Nov 2017
24 ng lower response to Vitamin D due to obesity, low initial Vitamin D, and genetics – RCT Feb 2015
4700 IU of vitamin D needed by most seniors – an equation -July 2014
Dose response equation square root of IU
Dose/response graph from GrassRoots
- Notice that response to 5000 IU varied from 30 ng to 140 ng
- Another dose response graph
- Approx 5,000 IU got the average to 45 ng, while one only got to 24 ng, but another achieved 65 ng

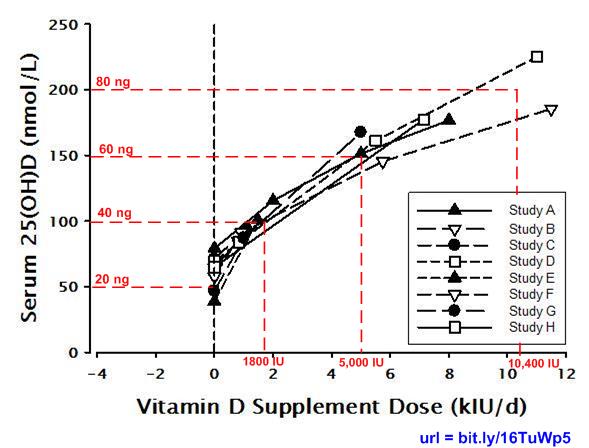
Response to Vitamin D: summary chart of 8 studies – March 2013 shows 5,000 IU dose would get avg of 60 ng
- Would higher dose to get a majority (say 97%) above 40 ng
- 200 IU needed to increase vitamin D levels by 1 ng (not 100 IU) – summary of 25 studies – Feb 2014 which has the following chart

- Same dose of vitamin D for everyone is virtually impossible - Dec 2015 has the following, from 36 studies
Short url = http://is.gd/doseresponse