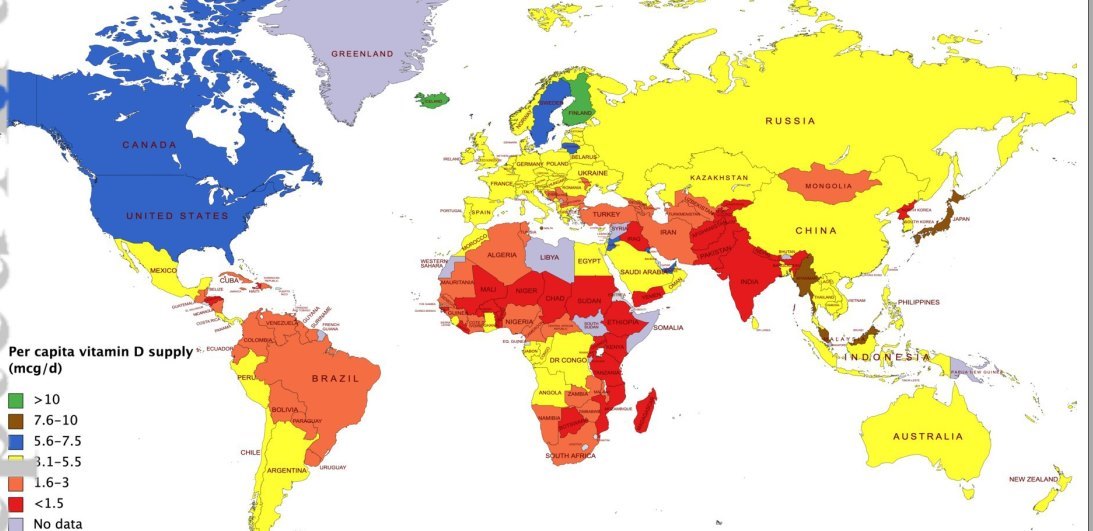
Global map of vitamin D intake (contains about 9 types of errors)
Global view of per capita daily vitamin D supply estimates as proxy measures for vitamin D intake data
Journal of Bone and Mineral Research PLUS https://doi.org/10.1002/jbm4.10547
Kevin D. Cashman
📄 Download the PDF from VitaminDWiki
Nationally representative data on vitamin D intake can inform on the adequacy of dietary supply of vitamin D in a population, but such data is lacking for a majority of countries. Estimates of average per capita supply of vitamin D, as calculated using information from the Food and Agriculture Organisation (FAO) national food balance sheets (FBS) can be used as proxy measures for vitamin D intake within a population. In the present work, FAO national FBS (from 2004 to 2017) for 173-178 countries around the globe were used to generate such average per capita vitamin D supply estimates. For countries where food fortification with vitamin D was common, the estimates accounted for this. Using the 2004-2013 FBS data, there was a large range in average per capita vitamin D supply ranging from 0.3 (Ethiopia) to 17.8 (Maldives) μg/day. Globally, 40, 60, 70, 4 , 2 and 2 countries had average per capita vitamin D supply estimates <1.5, 1.6-3, 3.1-5.5, 5.6-7.5, 7.6-10 and >10 μg/day, respectively. Pelagic fish was the major contributory food commodity (supplying 53-86%) in countries with supply >7.6 μg/day. Median per capita vitamin D supply estimates for constituent countries within Africa, Americas, Asia, Europe and Oceania were 1.4, 2.7, 2.8, 4.1 and 4.7 μg/day, respectively. These overall supply trends were mirrored in the 2014-2017 newer FBS data. Fortification of milk and dairy or wheat flour with vitamin D had an important impact on the vitamin D supply estimates (average increments of 1.6 and 3.1 μg/day, respectively). Overall, the work showed how the per capita daily vitamin D supply estimates, as surrogate for vitamin D intake data, can highlight countries where inadequacy of supply may be of concern. It also shows how fortification of food with vitamin D can have an important impact on addressing low vitamin D intake.