Quantifying the vitamin D economy in the body - Heaney
Figure 1

Quantifying the vitamin D economy
Nutrition Reviews VR Vol. 73(1):51–67, doi: 10.1093/nutrit/nuu004 Special Article
Robert P. Heaney and Laura A.G. Armas
R.P. Heaney is with Creighton University, Omaha, Nebraska, USA. rpheaney@creighton.edu
L.A.G. Armas is with the Department of Medicine, Creighton University, Omaha, Nebraska, USA
📄 Download the PDF with all figures from VitaminDWiki.
The following is virtually all of the text, most of the equations, and a few of the figures
Vitamin D enters the body through multiple routes and in a variety of chemical forms. Utilization varies with input, demand, and genetics. Vitamin D and its metabolites are carried in the blood on a Gc protein that has three principal alleles with differing binding affinities and ethnic prevalences. Three major metabolites are produced, which act via two routes, endocrine and autocrine/paracrine, and in two compartments, extracellular and intracellular. Metabolic consumption is influenced by physiological controls, noxious stimuli, and tissue demand. When administered as a supplement, varying dosing schedules produce major differences in serum metabolite profiles. To understand vitamin D's role in human physiology, it is necessary both to identify the foregoing entities, mechanisms, and pathways and, specifically, to quantify them. This review was performed to delineate the principal entities and transitions involved in the vitamin D economy, summarize the status of present knowledge of the applicable rates and masses, draw inferences about functions that are implicit in these quantifications, and point out implications for the determination of adequacy.
INTRODUCTION
The literature on vitamin D has grown exponentially in the last 25 years, and the bulk of the reported research has focused on effects, metabolites, mechanisms, and sites of action. While substantial controversy remains as to how much vitamin D is required for optimal health, there is essentially no disagreement in the scientific community about the many tissues, sites, and pathways in which the vitamin D metabolites are active. In the existing literature, no comprehensive review of the quantitative aspects of the various components that constitute what can be called the vitamin D “economy” could be located; the present review was performed to fill that gap. The entities comprising the vitamin D economy are shown in Figure 1, which maps the relevant components and transitions involved in the physiology of vitamin D.
Reviewed here are the pathways and compartment sizes shown in Figure 1; the article also suggests the best available estimates as to the rates and masses concerned and helps identify the still large body of rates for which adequate evidence is not presently available and that, therefore, remain topics for future investigation. The analyses are organized below in accordance with the principal zones depicted in Figure 1, as follows: inputs and sources, partitions and masses, and metabolism and utilization. The following questions are addressed: How large are the daily inputs of cholecalciferol (D3) and to what extent do the major sources contribute to that input? How much of the D3 input is 25-hydroxylated and how much is stored in fat? What fraction of 25-hydroxyl- ation occurs in the liver (with secretion back into the blood) and how much occurs directly in the target tissues, without being reflected in the measurable serum 25D levels? How important is serum concentration of the parent vitamin (D3) and what is the impact of various dosing intervals on that concentration? To what extent do specific tissue requirements differ among themselves?
Figure 1 Comprehensive scheme depicting the pathways and components that together comprise the vitamin D economy. The thickness of the various paths reflects their relative magnitudes. Asterisks indicate points where hydroxylation reactions occur. The three major divisions shown in dashed-line boxes define the scheme by which this topic is analyzed. Note that 1,24,25D, at the bottom of the Metabolism and Utilization section, is shown leading directly to disposal. That may not be entirely correct, as calcium absorption efficiency increases when the compound is administered as an endocrine agent. Whether that pathway is open to the 1,24,25D that is produced intracellularly is unknown.
Some of the presently available answers can be found in the vast literature on vitamin D; others are logical consequences of published quantifications that have not yet been integrated into the overall scheme of vitamin D physiology.
INPUTS AND SOURCES
There are basically three sources of vitamin D; two of them are natural (food and sun), and one is artificial (supplements, including fortificants). The partition of intake across the three sources in contemporary societies manifestly depends on dietary habits, geographical location, and exposure of skin to solar ultraviolet (UV)- B radiation. Hence, there is no single input quantity or source partition that accurately describes the situation for everyone. Thus, the best one can do is to estimate aggregate magnitudes and population averages.
In this regard, it has generally been assumed that cutaneous synthesis is the predominant natural source, likely accounting for most of the input under ancestral conditions, and that food sources were, for the most part, minor and confined mainly to such foods as wild- caught, oily fish. Perhaps it should have been evident that the food source had been underestimated, as species in the families Canidae and Felidae do not manufacture vitamin D in their skin1,2 and are hence dependent on vitamin D contained in the flesh and organs of prey animals. Since vitamin D requirements are body size-specific and the requirements of these mammalian species are considered to be of the same order of magnitude as those of humans,3 it should have been clear, in retrospect, that animal products contain more vitamin D than has been commonly recognized.
Total input
In reports from Europe and North America, mean serum 25-hydroxyvitamin D (25D) levels in unsupplemented individuals range from 10 to 40ng/mL. What is the size of the aggregate input behind these values? Studies of the rise in serum 25D in response to supplements in such individuals help to answer that question. Such studies typically display a curvilinear rise as supplement dose increases (Figure 2). The horizontal axis in these studies is usually denominated in terms of supplement intake, not total intake (which, of course, is not directly known). However, it has been suggested that extrapolation of the dose-response curves to the x-axis provides the best possible estimate of all-source, basal input in these individuals before supplementation.4 By simple translation along the x-axis of Figure 2, the magnitude of that input can be directly estimated. Graphing basal 25D concentration against basal intake in this way produces a plot with a slope of 1.0 ng/mL/100 IU/day for serum 25D. Calculations from several other dosing studies yield similar gradients (ranging, for the most part, from 0.65 to 1.1 ng/mL/100 IU/day). As rates and masses are estimated in the text below, and for ease of calculation, an equivalence value of 1 ng/mL is used to reflect an input of 100IU D3 (i.e., 1 nmol/L reflecting an input of 1 mg D3).
It follows from the value of this equivalence that unsupplemented individuals who average 20 ng/mL are receiving about 2,000 IU/day from nonsupplement sources (i.e., food and sun). However, reports of studies listing usual food sources, estimated from diet records, rarely include intakes of much more than 200 IU/day; this leaves an apparent input gap of about 1,800 IU/day at a 25D status of 20 ng/mL (and as much as 2,800 IU/d for those averaging 30 ng/mL). This gap, presumably, would be filled by solar synthesis and/or unrecognized food sources.
The following methodological matters are worth considering before input sources are discussed.
Consideration 1. While the foregoing equivalence value is commonly used clinically, 1 ng/mL is at the high end of the range of observed response gradients. Since it is the inverse gradient that is used to interpret serum 25D values, a high gradient value may underestimate somewhat the corresponding inputs. As already noted, several reports of clinical trials have produced changes in serum 25D >1.0 ng/mL/100 IU, and it is often assumed that response from a state of deficiency is more exuberant than responses observed in more replete individuals. Nevertheless, since the pharmacokinetic studies of response published to date seem to have produced figures in the range reported here, it is these data that were used in the present analysis.
Consideration 2. These calculations assume that orally ingested D3 is completely or nearly completely absorbed. Holick (personal communication) reports better than 90% absorption for high-dose D2. In an older study in which various dosing routes and regimens were described, Whyte et al.5 reported roughly comparable dose-adjusted increments of serum 25D for oral and intravenous routes of administered D3. Nevertheless, if actual vitamin D absorbability is substantially less than complete, several of the estimates of input and throughput in the remainder of this review will be erroneously high.
Consideration 3. The available literature and the analyses that follow assume comparability of 25D measurements across different studies, which is not entirely accurate. Appreciable methodological differences are well recognized. External referents, such as the vitamin D external quality assessment scheme (DEQAS),6 are of some help. However, many of the analyses in this review use internal referents (see, e.g., Figure 3) in which individuals or groups are compared to one another using the same 25D measurement method. Methodological problems are of less consequence in such instances.
Solar source
The usual presumption has been that the bulk of observed, unsupplemented basal vitamin D status has been accrued via cutaneous synthesis. That this is entirely possible at low latitudes and with outdoor employment is clear. It has been well established for roughly 30 years that in fair-skinned individuals, a single exposure to UV-B at one whole-body minimum erythema dose can produce a rise in serum 25D that is equivalent to an oral dose of D3 in the range of 10,000 to 25,000 IU.7 One minimum erythema dose can be produced by as little as 10-15 min of whole-body exposure at mid-day in mid-summer in a pale-skinned individual.
Studies by Armas et al.,8 using controlled doses of UV-B and careful measurement of skin pigmentation, have begun to quantify the relationship between UV-B irradiance and 25D response. Figure 3 depicts the rise in serum 25D after 4 weeks of three UV-B sessions per week, each delivering 30 mJ UV-B. As Figure 3 shows, and as has long been known in a general way, increase in serum 25D is an inverse function of skin pigmentation. In this instance, pale-skinned individuals of northern European ancestry exhibited a rise in serum 25D of 9 ng/mL (23 nmol/L) at the end of 4 weeks of exposure. By contrast, in extremely dark-skinned individuals, the rise was 4.5 ng/mL (11.2 nmol/L), or just slightly less than half as great as in pale-skinned individuals. The observed relationship was characterized by the following equation:
Z = 0.01094 * X * Y
with Z representing the change in 25(OH)D at 4 weeks, in nmol/L; X representing the lightness value of the individual’s unexposed skin; and Y representing the dose of UV-B (mJ/cm2) per radiation session. The goodness of fit for the model was excellent (R2 = 0.79). Applying this equation for a person with a skin lightness of 60 (relatively pale), 4 weeks of 40 mJ 3x/week would be expected to elevate 25D by about 10 ng/mL (26 nmol/L).
Holick7 previously showed that dark-skinned individuals had no perceptible rise in serum D3 in response to a UV-B dose that produced a large D3 increment in fair-skinned individuals. However, for reasons discussed below (see Partitions and Masses), serum D3 levels are not the most appropriate measure of an individual’s ability to respond to UV-B radiation. Individuals with low vitamin D status exhibit a rise in
25D often without a measurable increase in serum D3. This can be interpreted to mean that they convert D3 to 25D extremely rapidly, with serum D3 concentration rising only slightly.
Thus, variations in sun exposure will certainly account for some of the variations in basal status and could, in theory, completely account for most of that basal input. However, despite what may be possible in theory, actual measurements of solar-induced serum 25D are far smaller than needed to account for the gap.4 The magnitude of solar inputs in contemporary populations can be estimated from several large studies in which serum 25D was measured year-round in participants who were unsupplemented on entry.9-14 Data from one such study9 are shown in Figure 4, which clearly depicts the now commonly reported wide variation in vitamin D status among individuals; it also fits the data to a sine curve, thereby capturing seasonal change. As the figure shows, the nadir was reached in late winter, and the apex in late summer, as expected. The amplitude of the fitted sine curve was 3.62 ng/mL, for a total difference between winter and summer of 7.24 ng/mL (17 nmol/L). Other studies, analyzed similarly, produced even smaller summer-winter differences (ranging from 4.2 to 6.9 ng/ mL).10’11 In all analyzed, recently published studies, time of year accounted for <5% of the total variance. Using the above estimate of 1 ng/mL/100 IU, actual maximal summer input in these cohorts amounts to between 400 and 700 IU/day at the summer peak (relative to the winter nadir). Thus, actual solar synthesis does not account for very much of the total daily input in contemporary urban populations.
It has commonly been assumed that as summer inputs can exceed an individual’s summer vitamin D requirement, the unused summer surplus of D3 is stored in body fat and then released during the winter, thus sustaining the winter concentration of 25D. While plausible in theory, the estimates of actual vitamin D from solar production discussed above indicate that not enough is typically being produced to allow for such storage and, consistent with that conclusion, the measured fat content is too small15-18 to provide an appreciable source of D3 in the months when solar synthesis is not possible (see below, Partitions and Masses).

The study by Armas et al.,8 cited above, represents the first step at quantifying irradiance-specific production of D3 in human skin. However, because of the relatively slow release of D3 from the skin and the large variability in the rate of its 25-hydroxylation (see below, Partitions and Masses), such relatively short-term studies (4 weeks) may not capture the ultimate equilibrium value for steady-state, continuous UV-B exposure. However, Holick et al.19 reported results in a single individual irradiated at 0.75 minimum erythema dose three times per week, reaching an equilibrium increment of approximately 20ng/mL by week 7 of treatment. What can be said with some certainty is that equilibrium values will likely be somewhat higher than those measured by Armas et al. and that this response spans a roughly two-fold range between deeply pigmented and pale-skinned individuals.
Food source
The detection of vitamin D in food is technically difficult, and, until recently, most analyses of foods showed D3 contents below the detection limit of the available assay. However, that detection limit was sufficiently high to cover possible contents large enough to be biologically meaningful. Furthermore, it is now clear (and should have been from the outset) that all higher mammals possess the same basic vitamin D pathway, which converts D3 to 25D. Thus, the simple D3 content of an animal food product would not be representative of the total vitamin D activity contained therein, as it would fail to capture the portion of the activity due to 25D present in the various tissues concerned. Recent publications have shown that meat can contain substantial quantities of 25D20-25 and that consumers of meat exhibit higher human 25D status than nonconsumers.26,27
Even though there are now substantially more sensitive assays for D3 itself, reliable analyses of the amount of both D3 and 25D in food are still so sparse, and recent food table values are so inconsistent, that it is not currently possible to provide good estimates of dietary intake of vitamin D. Food databases in the United Kingdom include both the D3 and the 25D contents of foods, using a potency factor for 25D of 5x (see below); Canadian databases include both measures as well, but use a potency factor for 25D of 1 x; in the United States, only D3 is reported in food tables. Thus, depending on the food table used, a single food can appear to have very different levels of vitamin D activity. This situation is not likely to change much soon, as both D3 and 25D are now being added to commercial animal feed stocks, contributing substantial vitamin D activity to some animal-derived foods.
Despite the still fragmentary character of the data, the analyses published to date indicate that input gaps left after estimating solar inputs (on the order of 1,300-1,600 IU/day, as noted above) could well be filled by hitherto unrecognized food sources. For example, Taylor et al.21 report a combined (D3 plus 25D) content of 112IU vitamin D equivalents for 200 g of beef tenderloin and 230 IU equivalents for one large egg. The latter figure is confirmed in data developed by McDonnell et al.26 from the Grassroots Health database. In their cross-sectional analysis, one egg consumed daily was associated with 2 ng/mL greater level of serum 25D (implying an egg-related intake of 200 IU/egg).
In their estimates, Taylor et al.21 used a potency factor of 5x for 25D, based on the observation28-30 that oral 25D elevates serum 25D concentration to a substantially greater extent than does an equimolar oral dose of D3. This potency factor has implications that go well beyond food content and is discussed further below (see especially, Partitions and Masses).
Comment
This updated understanding of the relative magnitude of vitamin D sources has implications for the imputation of reverse causation. In observational studies in which low vitamin D status in various chronic disease states was found, it is possible that the disease concerned caused the low vitamin D status (rather than vice versa). It has been suggested that the disorder concerned led to decreased time outdoors and, hence, to decreased solar input. The now clearly small size of the solar contribution in both healthy controls and in participants with disease makes that hypothesis implausible, as the solar input in the control groups of current studies is often too small to explain the observed differences in vitamin D status, even with total sun avoidance. On the other hand, the expanded contribution of food sources offers a much more plausible basis for reverse causation (if and when it must be considered), as decreased food intake is a more likely concomitant of chronic disease than is sun avoidance.
Supplements
The matter of quantifying vitamin D intake from supplements is essentially tangential to the central focus of this review, as the vitamin D content is indicated on the product label and is subject, as is also the case for any nutrient in foods or supplements, to variation in manufacturer quality control, product shelf residency, and product storage conditions. These latter factors are sufficiently large as to make it necessary for interventional studies to include an assay of the supplied D3 at several points during the course of a study and not to rely on labeled content.
There are, however, three quantitative factors related to supplement intake that need mention. One is the effect of the vehicle on vitamin D absorption, another is the effect (if any) of co-ingested foods, and the third is the chemical nature of the vitamin D, i.e., D2 or D3.
Most commercial vitamin D supplements carry vitamin D either as a crystalline powder in a tablet that consists of otherwise inert excipients or in an oily vehicle (as in drops or gel caps). Whether the vehicle affects absorption of D3 is unclear. The literature on this topic is extremely limited, and studies in which the vehicle was the primary variable are even more limited. Further, the outcome variable in all published studies was not serum D3 but serum 25D. (This is, however, a reasonable proxy for relative [if not absolute] absorbability.) Maalouf et al.31 compared 14,000 IU D3 in ethanol and in a medium-chain fatty acid vehicle (Vigantol). They found a statistically significant, higher increase in 25D from baseline in the oil group than in the ethanol group. Holvik et al.32 examined the effect of 400 IU D3 administered in a multivitamin tablet containing cellulose and other vitamins and fillers versus 400 IU D3 administered in a fish oil capsule and found no significant differences in 25D response between the two groups. The Grassroots Health project collects data on supplement type and has found no difference in the 25D concentration achieved with either 5,000 or 10,000 IU daily doses, irrespective of whether the D3 was delivered via a gel cap in oil or as dry powder in a tablet (unpublished data; S. McDonnell, personal communication).
Vitamin D, being fat soluble, is often presumed to require co-ingested fat for optimal absorption. However, it should be recognized that for the quantities consumed (in the microgram range), usual solubility considerations may not be pertinent. As evidence of this point, Biancuzzo et al.33 showed that vitamin D could be absorbed from orange juice , and Tangpricha et al.34 reported no difference in absorption between milk and oil vehicles. On the other hand, fat malabsorption syndromes are known to lead to vitamin D deficiency , and the mechanism is generally considered to be a specific impairment in the absorption of the fat-soluble vitamin D. However, poor absorption may reflect not so much mucosal dysfunction, as simple sweeping of any fat-soluble compound out of the gut, dissolved in the unabsorbed fat. Dawson-Hughes et al.,35 using pharmacokinetic methods in individuals with normal absorptive function, reported equal absorbability for D3 under fasting and high-fat meal conditions, with slightly better absorption from a low-fat meal. Mulligan and Licata,36 in an observational study of 17 poor responders to oral D preparations, reported greater absorption from a large meal containing fat than from intake on an empty stomach. Too few studies of this issue have been reported to permit a reliable estimate of how much absorption of vitamin D may vary and what factors may influence that absorption. However, the limited data, taken as a whole, suggest that the effects of dosage form or vehicle are probably small.
Finally, the issue of D2 versus D3 needs brief mention. Formerly considered controversial, there now seems to be a growing consensus37 that, for equimolar quantities, orally administered D3 raises serum 25D by about twice as much as D2.38-42 This has been shown for bolus doses, short-term continuous administration (12 weeks), and long-term continuous administration (12 months). In one of the several studies that established this differential,40 the rise in 25D was fitted to an established43 exponential model in which Y represents the predicted rise in serum 25D, a represents the increment at equilibrium, and b represents the exponential rate constant in the following equation:
Y = a(1 - ebx)
Figure 5 Values of curve parameters for rise in 25D at 12 weeks of dosing with 50,000 IU/week for D2 and D3. The equilibrium increment (A) and the rate constant (B) are for the equation Y = a (7 - ebx). Data from Heaney et al.40
Figure 5 compares values for the two critical parameters for this equation (a and b). As is seen in panel A, the increment in equilibrium concentration for D3 is almost exactly twice that for D2. Correspondingly, the rate constant for D2 is nearly twice as large as for D3, reflecting the more rapid rise to steady state and the enhanced degradation of D2 observed in several reports.41,42 In this connection, as has been reported by several investigators, the enhanced clearance of 25D induced by D2 extends to both 25D2 and 25D3.38,41,42
Some of the decrease in serum 25D3 concentration observed in individuals on D2 administration could, in theory, reflect competition for the hepatic 25-hydroxylase, with administered D2 effectively reducing access to the 25-hydroxylase by endogenous D3. However, this is not likely to be a major factor as the rate constant for total 25D rise (and fall) is substantially greater for D2 than for D3 (Figure 5). Thus, to some extent, D2 processing by the body degrades the D3 obtained from food and solar sources, which is part of the reason for the two-fold difference in apparent potency.
PARTITIONS AND MASSES
Vitamin D enters the body from the intestine and the skin. Once in the blood, it undergoes two partitions, one chemical and one physical. The chemical partition (or conversion) involves further hydroxylations, first to 25D and then to 1,25D and/or 24,25D. The physical partition involves the extracellular and intracellular body compartments within which the hydroxylations occur. In the extracellular compartment, even though the involved hydroxylations take place intracellularly, the hydroxylated products are extruded back into the extracellular space. By contrast, in the intracellular compartment, hydroxylations occur within the various target tissues, and the resulting compounds act and are metabolically degraded there without affecting serum levels under usual conditions of health. The principal significance of this distinction is that, at a whole-organism level, direct access for quantifying hydroxylated products is confined to the extracellular compartment. Only indirect inferences can be drawn about the quantitative aspects of reactions in the intracellular compartment.
Serum vitamin D
Intestinal absorption of D3 is mainly from the jejunum and ileum. Absorbed vitamin D can be found in both the portal venous blood and the lymph that drains the small intestine. The lymphatic ducts are the typical route for fats , and in the presence of fat in the intestinal lumen, probably much of the absorbed vitamin D is transported that way, along with cholesterol and other lipids. The lymph drains into the systemic venous circulation, as does vitamin D absorbed from the epidermis. The lymphatic pathway may have particular physiological significance for orally acquired vitamin D, since it avoids a first pass of the absorbed vitamin D through the liver. This suggests that the quantitative relationship between vitamin D and 25D will be the same regardless of whether vitamin D enters from the skin or the gut.
Skin input occurs via passive diffusion of vitamin D into the blood from the plasma membrane of epidermal skin cells (where the photoconversion of 7- dehydrocholesterol occurs). This diffusion from the skin into the blood is slow, with a half-time of about 3 days .7 This half-time means that when regular sun exposure is the principal source of D3, serum D3 concentration will be essentially constant.
Vitamin D is transported in blood bound mainly to an actin-scavenging Gc protein characterized as D-binding protein (DBP). The binding sites for D metabolites on DBP are far from saturated, with D metabolites occupying typically <4% of the available binding capacity. There are three major alleles of DBP, with differing degrees of binding affinity. The apparently ancestral allele of DBP (Gc-1 F) has the highest binding affinity and is found in most individuals of African descent but in only a minority of individuals of northern European extraction. The allele with the lowest binding affinity (Gc-2) is most often found in the latter group. As with steroid-binding globulins, the free form of the compound is probably the metabolically active agent. DBP serves primarily to buffer day-to-day variations in input and metabolic consumption. This is especially true for 25D, which is bound to DBP much more tightly than is D3.
In addition to allelic variation, DBP concentration itself varies, contributing further to interindividual variation in free 25D. These relationships can be better appreciated by considering the following equation, which describes the equilibrium binding of a ligand to a protein
Kd= D* x DBP / [DBP - D*]
Here, Kd is the equilibrium dissociation constant for a particular vitamin D metabolite (with low numerical values reflecting tight binding and higher values reflecting lower binding affinity), D* is the metabolite concerned, DBP is the D-binding protein, and [DBP-D*] is the complex of DBP and the metabolite concerned. This equation can be rearranged as follows:
D= Kd x[DBP-D] / DBP
In this form, the equation makes clear that for a given vitamin D metabolite with a particular Kd, a lower value for DBP will mean a higher concentration of free vitamin D metabolite (and vice versa).
This was the reasoning used by Powe et al.44 in their study showing lower concentrations of DBP in individuals of African descent and suggesting that lower 25D values in African Americans did not, in themselves, reflect deficiency. (For any given total 25D value, a truly higher concentration of free 25D would translate to a lower vitamin D requirement.) However, both Bouillon45 and Hollis46 (as well as others) have responded that the DBP assay used by Powe et al.44 substantially underestimates precisely the allele of DBP that predominates in African Americans. As a result, the DBP values reported by Powe et al.44 are incorrect and cannot support any conclusion about the requirement. This issue nicely highlights the central importance of DBP and of its alleles in elucidating the details of the vitamin D economy.
Adipose tissue
Vitamin D in blood is generally considered to be in diffusional equilibrium with vitamin D in fat. To the authors’ knowledge, this assumption has never been tested. Nevertheless, given the ready solubility of D3 in both cell membrane lipids and adipocyte fat globules, this assumption is plausible and consistent with the limited data available. The character of that equilibrium in humans is not well established, with few studies reporting simultaneous measurements of fat and serum content. In one such study, Blum et al.15 reported the data shown in Figure 6, which were obtained from obese individuals at the time of bariatric surgery. As is apparent visually, there is considerable spread of the data. Nevertheless, it is reasonably certain from these limited observations that the concentration of vitamin D in fat tissue is substantially higher than the concentration in serum. By plotting the regression relationship using the data from Figure 4 and passing the line through the origin, a slope of approximately 12.0 is obtained, meaning that a given volume of fat tissue contains approximately 12 times as much vitamin D as the same volume of serum. Inspection of Figure 6 makes clear that the value of 12 can be only an approximation. However, a several-fold gradient is not surprising as D3 solubility in fat is effectively limitless, while DBP capacity, which is large, is finite.
Fig 6 Subcu. fat has12X higher concentration of D3 than serum

Figure 6 Replot of data showing the relationship between serum and subcutaneous fat concentrations of D3. (The units on the vertical axis can be converted to microgram per kilogram by multiplying by 0.384.) Data from Blum et al.15
There are relatively few reports of measures of vitamin D content in fat, irrespective of whether serum was measured as well.16-18 In those studies for which data are available, the amount of vitamin D in fat ranged from 38 to 116 mg/kg 100-300 nmol/kg) in adipose tissue samples obtained from unsupplemented individuals (often at the time of bariatric surgery). In some studies, visceral fat was found to contain somewhat more vitamin D than subcutaneous fat, while other studies showed the opposite . Whatever the reality may be, any very substantial difference in vitamin D content between the two types of fat would suggest something other than passive diffusion as the means of entrance into or exit from fat reservoirs. That issue remains unresolved at this time.
Assuming a diffusional mechanism and a total body fat mass of 35% of body weight, one can use the measure of vitamin D content from fat samples to estimate total body stores of vitamin D in adipose tissue. For the analyses mentioned above, these total body stores in an individual weighing 70 kg would range from 931 to 2,842 mg (37,240 to 113,680 IU). Using the calculations set forth in the prior section and applying them to an individual with a serum 25D level of 20 ng/ mL, whose metabolic consumption would be 2,000 IU vitamin D/day, the total amount in the reservoir would provide enough of a reserve for 18-57 days at that same rate of utilization. At a serum 25D level of 40ng/mL, that same reserve would support consumption for only 9-28 days. Neither estimate comes close to compensating for the “vitamin D winter” of most temperate latitudes. The relative smallness of this reserve in contemporary humans explains why in studies such as that of Barger-Lux et al.,47 even outdoor summer workers who had high daytime skin exposure experienced reductions in 25D averaging approximately 20 ng/mL (50 nmol/L) by late winter. Of note, their 25D values had reached >50 ng/mL (125 nmol/L) by late summer, which is roughly the same as that reported for East Africans living ancestral lifestyles.48 This study indicates both that existing stores at the end of summer were not adequate to maintain the achieved summer level and that the late winter level (30 ng/mL) represented a utilization of approximately 3,000 IU/day.
Chemical partition
Extracellular 25(OH)D. The first step in the chemical conversion of D3 is 25-hydroxylation. This reaction is generally considered to be mediated primarily by a hepatic microsomal enzyme encoded by the CYP2R1 gene, which seems to be the most efficient of the several enzymes that have been shown to be capable of 25- hydroxylation.49,50 However, CYP2R1-null mice still exhibit circulating 25D, though at a substantially lower concentration than in wild-type animals. Bikle et al.51 showed that skin cells contain all the requisite enzymatic apparatus to produce both 25D and 1,25D. However, it is doubtful that under ordinary circumstances, skin is a major source of the extracellular 25D measured in serum (D. Bikle, personal communication). Other sources remain to be identified.
The efficiency with which D3 is converted to 25D varies widely from individual to individual. Figure 7 presents the time courses of serum 25D in two healthy adults following a single 100,000-IU oral dose of D3; this information was drawn from Ilahi et al.52 As can be seen, participant A exhibited a very rapid rise, with a Tmax at 3 days, while participant B responded much more slowly.
Fig 7 Different responses to 100,000 IU

Figure 7 Time course of serum 25D in two participants each given a single oral dose of 100,000 IU D3 at zero time. The 25D peaked in participant A at 3 days, while 25D continued to rise in participant B for 2 months. (To convert nmol/L to ng/mL, multiply by 0.4.) Data from Ilahi et al.52
Participant B’s 25D concentration never peaked as participant A’s did; instead, it continued to rise for at least 2 months. Although only limited D3 values are available for these participants, it seems likely that participant B, with a slow conversion of D3 to 25D, had a more prolonged elevation of serum D, leading to greater transfer into the adipose tissue compartment from which it was slowly released over the ensuing weeks. This may explain why, despite the slow rise, the area under the curve at 10 weeks in participant B was actually about one-third larger than the area under the curve for participant A.
Various reasons can be put forth for these inter-individual differences that, though studied in somewhat less detail, have been reported by many investigators. One example is the variable methylation of the CYP2R1 gene and, hence, variable expression of the hepatic 25-hydroxylase.53 While there is currently no final answer, it is clear from inspection of Figure 7 that differences in intestinal absorption of D3 could not explain the slow rise in participant B, relative to participant A. Moreover, the internal consistency in the shape of the respective curves virtually excludes methodological variability as a cause of the difference.
An important quantitative feature of this conversion was published several years ago in a set of data pooled from several laboratories, shown here in Figure 8.54 The figure plots serum 25D as a function of serum D3. As D3 is the substrate for the 25- hydroxylation reaction, it is to be expected that there would be a generally positive relationship, with 25D rising as serum vitamin D rises. However, as the figure shows, the rise is biphasic. At very low serum D3 concentrations, 25D concentration rises very rapidly . In several of the individuals treated with supplemental D3, although 25D rose substantially, no change in D3 could be detected.
Figure 8 Serum 25D concentration plotted as a function of serum D3 concentration. (To convert nmol/L to ng/mL, multiply by 0.4.) Data from Heaney et al.54
At a serum D3 concentration of about 10 nmol/L, the rate of conversion to 25D decreases appreciably. This behavior is consistent with first-order enzyme kinetics for the 25-hydroxylation reaction at low substrate concentrations, changing to zero order once the substrate concentration exceeds some threshold value. The equation for this curve is
Y = 0.433X + 87.8(1 - e-0:468X)
with Y representing serum 25D and X representing serum D3. In this case, the threshold is at about 8 nmol/L for D3 and 90 nmol/L for 25D. The significance of these values lies in the fact that if serum D3 concentration is determined to be important in its own right (see below), total D3 inputs will have to be sufficient to support a 25D value of at least 100 nmol/L (40ng/mL) in order to ensure a D3 value of 10 nmol/L or higher. At lesser inputs, D3 is converted virtually quantitatively to 25D (see information above) and its serum concentration remains close to zero.
Extracellular 1,25(OH)2D. The second hydroxylation, which produces extracellular 1,25D, occurs predominantly in the proximal convoluted tubular cells of the kidney. While 25-hydroxylation is not highly regulated, the opposite is true for 1,25D, the synthesis of which is upregulated by parathyroid hormone and low serum inorganic phosphorus concentration and downregulated by fibroblast growth factor-23. Note that 1,25D is a principal regulator of intestinal absorption of calcium; during this process, it acts by upregulating expression of the calcium transport apparatus of the enterocyte. This is an endocrine effect as it is mediated through serum endocrine-like activity and exhibits a typical negative feedback control loop. Under usual conditions, 1,25D is necessary for regulation of calcium absorption. However, it is not the only factor involved in this process. It should also be noted that in the absence of other vitamin D metabolites, 1,25D by itself has been reported not to be sufficient to elevate intestinal calcium absorption.55,56
As would be expected for regulator molecules, the serum half-time of 1,25D is short (hours). Its concentration in serum is a reflection mainly of relative calcium need—being high in individuals on low-calcium diets or in those with calcium malabsorption and low in individuals with high calcium intakes. Also, 1,25D has long been recognized to be calcemic when used therapeutically. The mechanism is generally attributed to intestinal calcium absorption, but this cannot be a satisfactory explanation, as increased metabolic input alone (i.e., without considering output) is rarely sufficient to elevate the serum concentration of any metabolite. Moreover, 1,25D and its analogs do not elevate calcium absorption in patients with end-stage renal disease,57 a condition in which the calcemic effect of 1,25D is often readily apparent. While not adequately explored, there remains another possibility, i.e., an effect of 1,25D on bone-lining cells, where a fall in bone fluid pH to just below 7.0 is enough to solubilize bone mineral sufficiently to elevate serum calcium.58
Physical partition
The distinction between the endocrine and the autocrine pathways is one aspect of the physical partition between extracellular and intracellular processing of the vitamin. The prevailing assumption seems to be that most or all of the D3 entering the body is 25- hydroxylated and that the resulting 25D circulates in the blood, where it serves as the substrate for both renal and extrarenal 1 -a-hydroxylation, with the renal 1,25D product circulating in the blood like 25D and with the extrarenal 1,25D never being expressed in the only accessible body compartment, i.e., the blood.
As Hollis and Wagner59 have pointed out, D3 enters cells more readily than does 25D and, as noted above, there are several enzymes other than the hepatic CYP2R1 that are capable of 25-hydroxylation of D3.49,50 Hence, a physical partition of the vitamin D pathways prior to the 25-hydroxylation step has to be given serious consideration. That this is more than just a theoretical possibility is suggested by the fact, noted earlier, that oral 25D elevates serum 25D to a substantially greater extent than does oral D3.28-30 This was shown first by Barger-Lux et al.28 in a 10-week dosing study involving the two molecules.
Figure 9 Change in serum 25D plotted as a function of intake for varying oral doses of 25D and D3. Data from Barger-Lux et al.28
Figure 9 plots the 25D response to the two agents observed in a group of 54 healthy adults and shows a clear divergence of the dose response curves, with a greater than seven-fold difference in slopes . Cashman et al.,30 using a different design, found an approximate five-fold difference in response after 10 weeks of dosing, and Bischoff-Ferrari et al.,29 an approximate four-fold difference after 17 weeks of dosing.
That there should be a greater rise in 25D when oral 25D is the source is, in a sense, trivial, as oral 25D is immediately reflected in the serum, while oral vitamin D must first be 25-hydroxylated, a process that, as described above, is necessarily slower, sometimes substantially so. Only a proper pharmacokinetic study that compares area-under-the-curve values for the two agents can fully quantify this difference. Such a study must either be long enough to allow the 25D plateau to be reached while on continuous dosing of D3 43 or, if using a bolus dose design, must follow the time course for the two agents for probably 4 months so as to allow full 25-hydroxylation of the administered D3 and full consumption of the administered 25D. No such data are currently available, and this aspect of the physical partition must remain speculative. Nevertheless, the issue is an important one, not just for the therapeutics of 25D but also for a full understanding of the vitamin D economy (see below).
The 25D half-time (as measured by Clements et al.60-62 using tracer-labeled 25D) presents certain puzzling features in its own right. A half-time of, say, 20 days (toward the lower end of the range found by Clements et al.) translates to a daily turnover of about 3.47% of the total mass of extracellular 25D. If the size of daily utilization is known, it is possible to calculate the size of the 25D mass from that fractional utilization rate. If all of the vitamin D input to the body is converted to extracellular 25D, then at a serum 25D concentration of 20ng/mL (requiring, as shown above, a daily input of 50 mg), that 50-p.g input is numerically equal to the daily turnover. So, total 25D mass would be 50/0.03 47, or close to 1,500 mg. This figure is larger by an order of magnitude than that of the measurable total serum content of 25D, and the discrepancy becomes even larger at higher serum 25D concentrations or longer half-times. This seeming discrepancy has not been noted previously, with one potential reason being the computational difficulty of harmonizing biological units (IU), first with mass concentrations (mg/mL), then with SI units (nmol). However, if a substantial fraction of daily input of D3 is 25-hydroxylated intracellularly, after which it is immediately activated to 1,25D, then only the 25D in the extracellular compartment would be labeled by a tracer-based approach to kinetic analysis, and the calculated daily utilization of the circulating 25D would be lower and the corresponding 25D mass estimate would be closer to what is known from blood and soft tissue content. These calculations provide support for the suggestion of Hollis and Wagner59 that “parent compound D” has more functional significance than has usually been thought.
There is one quantitative aspect of the physical partition, whether occurring prior to or after the 25- hydroxylation step, which seems inescapable. Whether one takes as optimal a serum 25D concentration of 20 ng/mL or 40 ng/mL, the molar equivalent D3 inputs required to sustain either level are far higher than the moles of 1,25D required to support the calcium economy. As noted above, a serum 25D of 40 ng/mL requires approximately 4,000 IU/day, or 100 mg/day, and a serum 25D of 20 ng/mL requires approximately 2,000 IU/day, or 50 mg/day. By contrast, the calcium economy requires between 0.5 mg and 2.0 mg of 1,25D/day. (Higher doses, as noted above, produce hypercalcemia.) It follows that >90% of D3 utilization is occurring along the intracellular/autocrine pathway. If that is not the case, then most of the D3 input to the body is degraded metabolically and not used at all. The latter possibility seems quite improbable, particularly in view of the marginal or subadequate vitamin D status that seems nearly universal. Answering this question of the relative potency of oral D3 and 25D will illuminate the partition of D3 between the extracellular and intracellular pathways and will be an important step in unraveling the puzzle of the physical partition.
One instance in which the pre-25D intracellular pathway is operative is the transfer of vitamin D activity into human breast milk.59,63 25D does not transfer across the secretory mucosa of the mammary gland with sufficient efficiency to produce enough vitamin D activity in milk to nourish the infant, while D3 does. However, for this to occur, D3 must be present in the blood that bathes the mammary secretory apparatus. In earlier work, Hollis et al.63 showed that the concentration of vitamin D in human milk was about 28% of the concentration of D3 in maternal blood. In subsequent work (B. Hollis, personal communication), that figure was shown to be closer to 32%, and a recent study by Oberhelman et al.64 showed a transfer fraction that can be calculated to be about 44%. Based on recommendations of both the American Academy of Pediatrics and the Institute of Medicine for infant intake (400 IU vitamin D/day, which requires a milk concentration of about 520 IU/L, i.e., 34 nmol/L), these transfer fractions would require a maternal serum vitamin D concentration of about 30-40 ng/mL (78-120 nmol/L). (The corresponding 25D concentration would be >50ng/mL [125 nmol/L]; see Figure 8.) Hollis and Wagner59 estimate that the total input of D3 needed to maintain a milk concentration sufficient to meet the infant’s needs for vitamin D was approximately 6,000 IU/ day. The equivalence value derived above produces a needed input of approximately 6,000 IU/day, which is essentially identical to the empirical estimate of Hollis and Wagner.
Dosing schedules and serum D3 concentrations
Dosing frequency for oral vitamin D supplementation regimens will affect serum concentration of D3 in predictable and often very striking ways. This fact has been largely overlooked to date, as the serum concentration of D3 has been generally considered to be of no particular interest in its own right. The rationale for infrequent (or bolus) dosing is that it leads to better adherence and that an excess amount ingested today will be stored in fat for use tomorrow. However, this assumption overlooks the effect of infrequent dosing regimens on D3 blood concentrations.
Serum D3 has a half-time variously estimated to be in the range of 0.5-3.5 days, with most investigators favoring a value of about 1.0 days. In contrast, D3 produced in skin moves into the blood with a half-time of about 3 days. This means that when skin synthesis is the principal source of D3, serum D3 concentration will be essentially constant around the clock, as D3 input to the blood from the skin (though produced mainly at mid-day) is effectively constant. With oral ingestion, intestinal absorptive input of D3 occurs mainly during a 4-h period following ingestion. (In one study, a TMAX of as much as 12 h was reported.65 As this is well beyond the usual mouth-to-cecum transit time, the 12-h figure, if confirmed, would suggest appreciable colonic absorption, or small bowel mucosal retention, or a delay pool in the intestinal lymphatics.) In any case, assuming a 1.0-day half-time, serum D3 concentration will inevitably follow a sawtooth pattern, particularly if oral ingestion is the principal input. Figure 10 displays the patterns for purely cutaneous input and for daily, weekly, and biweekly oral administration. With a once- a-week schedule, as is evident from Figure 10, serum D3 concentrations are close to zero for several days each week and below the reference level for most of the interdose interval. Thus, in the practical order, a nursing woman who takes her total weekly dose of vitamin D once each week would produce milk with little or no D content for roughly 4 of the 7 days in each week. This irregular delivery will be even more pronounced with biweekly or less frequent dosing schedules.
It should be stressed that Figure 10 illustrates the concept and is not a depiction of actually measured serum concentrations of D3. Under input conditions in excess of daily use, unused D3 will accumulate in fat and its concentration there would be predicted to damp the oscillations of D3 concentration in serum to some extent.
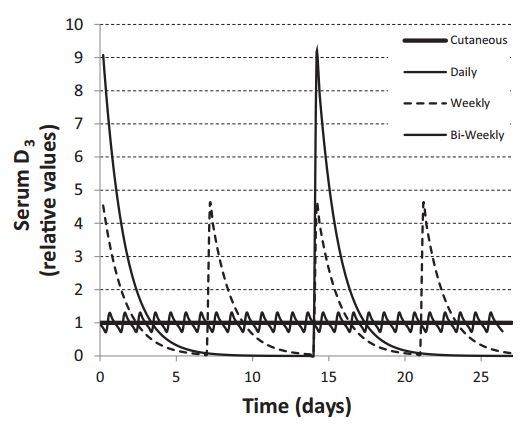
Figure 10 Calculated time courses for serum D3 concentration for varying oral dosing intervals. The reference level is the serum concentration for continuous (as contrasted with intermittent) dosing. Each dosing scheme provides the same cumulative intake, according to one of the following regimens: once daily, or 7 times the daily intake once weekly, or 14 times the daily intake once every 2 weeks.
An additional feature of interval dosing is the high D3 concentration peaks achieved in the days following each dose. The impact of such high D3 levels is unclear, although Vieth 66 has pointed to the induction of the 24-hydroxylation pathway as a likely consequence, with a corresponding reduction in effective vitamin D activity. Further, as the binding capacity of DBP is approximately 4.7 mmol 67 (or 78,000 IU/L), with true Stoss therapie, as in several recent studies,68’69 the DBP will be fully saturated by the ingested D3, resulting in displacement of both 1,25D and 25D off DBP and into circulation as free or unbound moieties for several days after dosing (i.e., until fat uptake lowers serum D3 sufficiently). This effect amounts to a transient vitamin D intoxication of uncertain physiological import. Unfortunately, there is essentially no published information about vitamin D concentrations in the immediate post-dosing period following large bolus doses. Whatever else may be said of Stoss therapie, it certainly is not physiological.
Factors influencing serum 25D concentration
Aside from the possible importance of D3 concentration as the substrate for autocrine activity of vitamin D, there is general agreement that serum 25D concentration is currently the principal indicator of vitamin D status.70 This is because extrarenal conversion of 25D to 1,25D operates at concentrations below the kM for the tissue 1 -a-hydroxylases; hence, serum 25D concentration limits the amount of 1,25D a tissue can synthesize when its cells are stimulated to produce a vitamin D-dependent response. While there is no consensus as to the optimal serum 25D concentration, there is also no disagreement about the importance of the substrate, regardless of which concentration may be deemed optimal.
Input of D3, a factor that manifestly affects 25D concentration, has been the subject of much of the previous discussion. Attention is now focused on the effect on serum concentration of 25D produced by variations in body size and in D3 output, i.e., utilization and/or degradation of the 25D in serum.
Obesity . One widely recognized influence on 25D concentration is obesity, with serum 25D being lower in obese individuals. This was originally attributed to a phenomenon termed “sequestration” (implying trapping of vitamin D in adipose tissue of obese individuals).71 However, Drincic et al.72 have shown that simple volumetric dilution is both a more logical explanation and one that fully explains the weight-based difference. Curiously, body mass index works in various regression models almost as well as body weight (and somewhat better in some datasets). This is surprising as body mass index is not a measure of mass but of fatness. The reason is presently unclear, and this observation suggests the possible existence of further mechanisms operating in obese individuals.
Parathyroid hormone-1,25D axis . Clements et al.60-62 showed that 25D half-time in serum ranged from 15 to >35 days, with 25D half-time being inversely related to parathyroid hormone concentration. The parathyroid hormone effect, noted both in patients with hyperparathyroidism and in animals subjected to calcium deprivation, was, in turn, mediated by serum 1,25D concentration. Why 25D utilization (or degradation) should rise in the face of calcium need is physiologically unclear, particularly as renal 1,25D synthesis is not as dependent on 25D concentration as the autocrine functions of vitamin D.
Inflammation . The other major influence on serum 25D concentration is inflammation. It has been reported that vitamin D status is reduced in the face of systemic inflammatory processes.73-78 For example, Duncan et al.75 reported an inverse correlation of 25D with serum C-reactive protein, with 25D being 40% lower as serum C-reactive protein rose from <5mg/L to >80mg/L. Autier et al.,79 in a metaanalysis of the several reports on this relationship, confirmed the existence of the association but attributed the reduced vitamin D status to underlying illness rather than to the inflammation itself. That conclusion may be partly correct, at least for some chronic illnesses, but it cannot apply to the many documented cases in which vitamin D status drops acutely across an inflammatory episode, as with total knee arthroplasty.73,77 In one case study, Henriksen et al.73 reported a 12% drop in 25D by day 2 after total knee arthroplasty and a nearly 80% drop by post-surgery week 8. Reid et al.77 evaluated a series of 33 patients who underwent total knee arthroplasty and reported an approximate 40% drop in total 25D and a 33% drop in calculated free 25D by day 2 after surgery , which was associated with large increases in C-reactive protein.
Decreases in 25D of this magnitude and rapidity cannot be explained by decreased synthesis and must, therefore, reflect increased utilization, degradation, or loss . Depending on which values may be estimated for the total 25D mass (see above), reductions in 25D concentration of the size reported by Reid et al. translate to a loss of several hundred micrograms from the body, which is substantially greater than ordinary daily utilization of vitamin D. While increased utilization cannot be ruled ou t, it seems unlikely to be the sole explanation. Another possibility, which was suggested by Waldron et al.,76 is the loss of DBP (with its bound ligand) in the urine . In 30 patients undergoing elective orthopedic surgery, the ratio of DBP to creatinine in urine rose 2.5 x by the second day post-surgery; this was associated with a >20-fold increase in C-reactive protein. Renal loss could certainly explain much or all of the change in 25D observed in these studies and could be the result of interference with the kidney’s megalin-cubilin system, possibly produced by the anesthesia or inflammatory cytokines associated with the surgery.
Although not directly related to the major focus of this review, the conclusion reached by several of the authors of the studies just reviewed, i.e., that, while inflammation clearly reduced D status, this reduction was without nutritional significance, is in no way supported by data in any of the papers concerned, nor is it consistent with the importance of serum 25D concentration as the principal limiting factor in the autocrine pathway.
24-Hydroxylation
The enzyme encoded by the CYP24A1 gene (the 24-hydroxylase) is expressed in all tissues in which vitamin D is active. Indeed, it is virtually always co-expressed when the 1 -a-hydroxylase gene is expressed. The resulting 24-hydroxylation of 1,25D serves to terminate the effect of 1,25D, thereby preventing excessive vitamin D activity. It is known that CYP24A1- null mice die from hypercalcemia, presumably related to an inability to deactivate 1,25D.80 It is likely that all, or virtually all, of the 1,25D produced and acting in both the endocrine and autocrine vitamin D pathways is 24-hydroxylated by CYP24A1 and that this hydroxylation is the first step in a series of oxidations that complete the deactivation of 1,25D.
Additionally, CYP24A1 catalyzes the 24- hydroxylation of 25D circulating in the blood, a reaction that, like endocrine 1 -a-hydroxylation, occurs mainly in the kidney.81 The resulting 24,25D circulates in the blood. The physiological role for this metabolite remains inadequately explored. It is not, however, without functional activity. It is known that 24,25D improves fracture healing,82 and in work performed four decades ago, 24,25D was shown to be substantially more potent in repairing the mineralization defect of nutritional vitamin D deficiency than was 1,25D.56 The 24,25D circulates in the blood at approximately 0.14 times the concentration of 25D, a ratio that is effectively constant across a broad range of 25D values.83 It is worth recalling in this context that when serum 25D concentration is low (as in nutritional vitamin D deficiency), serum 24,25D is low as well.
Despite the widespread expression of CYP24A1, the kidney appears to be the principal site for synthesis of circulating 24,25D, as serum 24,25D is very low in the serum of patients with end-stage renal disease and rises only slightly when these patients are given large oral doses of D3.84 How the synthesis of 24,25D is controlled and whether the serum ratio of 25D:24,25D is regulated are not known.
METABOLISM AND UTILIZATION
There is virtually no quantitative information on metabolism and utilization. The default presumption is that most, or all, of the vitamin D input ultimately acts either through the canonical hydroxylation pathway (vitamin D ! 25D ! 1,25D) or the alternative 24,25D pathway just discussed (vitamin D ! 25D ! 24,25D). Further hydroxylation steps for either pathway lead to deactivation and excretion of the resulting byproducts. Whether any appreciable fraction of vitamin D input is “wasted” by excretion or prior deactivation is unclear.
Perhaps of even greater importance is the present lack of knowledge regarding the magnitude of tissue- level demand for 1,25D; it is also not known whether that demand differs from tissue to tissue. In other words, is there a hierarchy of demands among body systems, such as with vitamin K? 85 What is somewhat more certain is that in tissues that respond to a stimulus requiring 1,25D for gene expression, the local (intracellular) concentration of 1,25D is higher than the level of 1,25D circulating in the blood 86-88 by as much as an order of magnitude. This is a feature that ensures tissue- specific, local vitamin D gene expression and activity. Since, as noted above, the tissue 1 -a-hydroxylases operate below their kM, the amount of 1,25D produced when a specific tissue responds is dependent on precursor concentration. In brief, are some tissue responses able to function adequately at lower levels? Or do some require higher levels? Existing knowledge is insufficient to answer these questions.
Comment
Most of the pathways and virtual compartments discussed in this analysis have been recognized for some time. What the present quantitative analysis offers is both a better grasp of their relative magnitudes and a perspective on some of the physiological implications of those magnitudes. For example, the data assembled here make clear that, even with today’s widespread vitamin D inadequacy, total vitamin D inputs are far higher than previously thought, food sources are greater than previously recognized, and solar input, though theoretically capable of fully meeting any plausible vitamin D requirement, is actually only a minor present-day contributor to total vitamin D input at the population level. That does not mean that the human requirement is more easily met. Rather, it indicates that the requirement is higher than previously recognized, with populations still short of meeting that requirement by the amount needed to move prevailing serum 25D concentrations from current values to putatively healthier levels.
These analyses also make clear that at prevailing inputs (i.e., <4,000 IU/day), D3 is rapidly 25-hydroxylated and little D3 circulates in the blood or is shunted into adipose tissue for storage. Additionally, the recent recognition that oral 25D may raise serum 25D to a significantly greater extent than does oral vitamin D suggests the possibility of a hitherto little recognized or explored intracellular pathway in which the entire metabolic sequence is handled within certain target tissues and is not reflected in blood. A related finding in this respect is the importance of a maternal serum D3 concentration sufficient to support production of human milk capable of meeting infant needs for vitamin D.
Several of these insights have implications for the human requirement. For example, the vitamin D input needed to support an adequate amount of vitamin D in human milk has implications not just for lactation but also for human success as a species under presupplementation conditions. Inadequate vitamin D input in newborns would be expected to lead to skeletal abnormalities (for which the paleo-fossil record provides no evidence), in addition to possible consequences for immune system development.89 A total input of approximately 6,000 IU in modern humans equips them to feed their infants with a nearly full range of the nutrients needed for healthy growth.
Another example is the better understanding of the role of adipose tissue in vitamin D storage. As storage appears to be mediated by a diffusional equilibrium between the DBP-bound vitamin D in serum and fat solubilization in adipocytes, substantial storage requires a non-negligible vitamin D concentration in serum. Even a 12-fold concentration gradient between fat and serum15 will not result in appreciable storage if the serum vitamin D level is, e.g., <5nmol/L. What the analysis of the relationship between serum D and serum 25D provides 54 is an estimate of the point at which 25- hydroxylation saturates, allowing vitamin D concentration to rise and currently unused vitamin D to be stored in fat. As the available data (reviewed above) indicate, that occurs at a vitamin D concentration of about 10 nmol/L and a 25D concentration of about 100 nmol/ L. These values, not surprisingly, are precisely the ones at which vitamin D concentration in human milk begins to rise.
Missing information (8 items)
Following is a partial list of principal information gaps that need to be filled in order to provide a more complete description of the vitamin D economy:
1) more complete and consistent analyses of the vitamin D and 25D content of foods;
2) better quantification of the relative potency of D3 and 25D in regard to raising the serum concentration of 25D;
3) fuller elucidation of the physiological role of serum concentration of D3, per se;
4) clarification of the intestinal absorbability of orally administered D3 and of the factors that influence absorption of D3;
5) elucidation of the relationship between steady-state fat and serum concentrations of vitamin D (and definition of the mechanism for transfer in and out of fat);
6) better understanding of the causes and mechanisms for the great variability in hydroxylation of D3 to circulating 25D;
7) elucidation of the intracellular concentration of 1,25D needed for tissue-level vitamin D effects, together with a description of a hierarchy of tissue-level needs (if any); and
8) better description of the physiological function of 24,25D and the regulation (if any) of its serum concentration.
CONCLUSION
Precise quantification of vitamin D inputs, transfers, conversions, and compartment sizes are essential for a full understanding of how the human body utilizes this essential micronutrient, why it is important, and what the consequences are of an inadequate vitamin D input. Sufficient information on various quantitative aspects of vitamin D physiology exists in the published literature to permit both the approximate mapping summarized in this review and to define an agenda for the quantifying work that still needs to be done. The value of such mapping goes beyond simple description, as evidenced in its pointing to otherwise unrecognized pathways that may be potentially important. Finally, it needs to be stressed (and should be obvious) that the organizing framework for the studies summarized here is whole-organism physiology. It is, thus, complementary to, rather than in opposition to, the mechanistic elucidation of vitamin D effects at molecular biological and molecular genetic levels.
Acknowledgments
The authors gratefully acknowledge the assistance of Leo Baggerly, PhD, in modeling the effect of intermittent dosing of D3.
Declaration of interest. The authors have no relevant interests to declare.
REFERENCES
How KL, Hazewinkel HA, Mol JA. Dietary vitamin D dependence of cat and dog due to inadequate cutaneous synthesis of vitamin D. Gen Comp Endocrinol. 1994;96(1):12-18.
Morris JG. Ineffective vitamin D synthesis in cats is reversed by an inhibitor of 7-dehydrocholestrol-delta7-reductase. J Nutr. 1999;129(4):903-908.
National Research Council. Nutrient Requirements of Dogs and Cats. Washington, DC: The National Academies Press; 2006.
Heaney RP, Armas LA, French C. All-source basal vitamin D inputs are greater than previously thought and cutaneous inputs are smaller. J Nutr. 2013;143(5):571-575.
Whyte MP, Haddad JG Jr, Walters DD, et al. Vitamin D bioavailability: Serum 25- hydroxyvitamin D levels in man after oral, subcutaneous, intramuscular, and intravenous vitamin D administration. J Clin Endocrinol Metab. 1979;48(6):906-911.
Carter GD, Carter CR, Gunter E, et al. Measurement of vitamin D metabolites: An international perspective on methodology and clinical interpretation. J Steroid Biochem Mol Biol. 2004;89-90(1-5):467-471.
Holick MF. The photobiology of vitamin D and its consequences for humans. Ann N Y Acad Sci. 1985;453:1-13.
Armas LA, Dowell S, Akhter M, et al. Ultraviolet-B radiation increases serum 25-hydroxyvitamin D levels: The effect of UVB dose and skin color. J Am Acad Dermatol. 2007;57(4):588-593.
Garland CF, French CB, Baggerly LL, et al. Vitamin D supplement doses and serum 25-hydroxyvitamin D in the range associated with cancer prevention. Anticancer Res. 2011;31:607-612.
Lappe JM, Davies KM, Travers Gustafson D, et al. Vitamin D status in a rural postmenopausal female population. J Am Coll Nutr. 2006;25(5):395-402.
Rapuri PB, Kinyamu HK, Gallagher JC, et al. Seasonal changes in calciotropic hormones, bone markers, and bone mineral density in elderly women. J Clin Endocrinol Metab. 2002;87(5):2024-2032.
Heaney RP. Toward a physiological referent for the vitamin D requirement. J Invest Endocrinol. 2014; doi: 10.1007/s40618-014-0190-6.
Munger KL, Levin LI, Hollis BW, et al. Serum 25-hydroxyvitamin D levels and risk of multiple sclerosis.JAMA. 2006;296(23):2832-2838.
Orwoll E, Nielson CM, Marshall LM, et al. Vitamin D deficiency in older men. J Clin Endocrinol Metab. 2009;94(4):1214-1222.
Blum M, Dolnikowski G, Seyoum E, et al. Vitamin D(3) in fat tissue. Endocrine. 2008;33(1):90-94.
Beckman LM, Earthman CP, Thomas W, et al. Serum 25(OH) vitamin D concentration changes after roux-en-Y gastric bypass surgery. Obesity (Silver Spring). 2013;21(12):E599-606.
Pramyothin P, Biancuzzo RM, Lu Z, et al. Vitamin D in adipose tissue and serum 25-hydroxyvitamin D after roux-en-Y gastric bypass. Obesity (Silver Spring). 2011;19(11):2228-2234.
Lawson DE, Douglas J, Lean M, et al. Estimation ofvitamin D3 and 25-hydroxyvita- min D3 in muscle and adipose tissue of rats and man. Clin Chim Acta. 1986;157(2):175-181.
Holick MF, Chen TC, Lu Z, et al. Vitamin D and skin physiology: A D-lightful story. J Bone Miner Res. 2007;22 (Suppl 2):V28-33.
Schmid A, Walther B. Natural vitamin D content in animal products. Adv Nutr. 2013;4(4):453-462.
Taylor CL, Patterson KY, Roseland JM, et al. Including food 25-hydroxyvitamin D in intake estimates may reduce the discrepancy between dietary and serum measures ofvitamin Dstatus.J Nutr.2014;144(5):654-659.
Liu J, Greenfield H, Strobel N, et al. The influence of latitude on the concentration of vitamin D3 and 25-hydroxy-vitamin D3 in Australian red meat. Food Chem. 2013;140(3):432-435.
Hymoller L, Jensen SK. Vitamin D(3) synthesis in the entire skin surface of dairy cows despite hair coverage. J Dairy Sci. 2010;93(5):2025-2029.
Schutkowski A, KramerJ, KlugeH,etal. UVB exposure offar manimals: Study on a food-based strategy to bridge the gap between current vitamin D intakes and dietarytargets. PLoSOne. 2013;8(7):e69418.doi: 10.1371/journal.pone.0069418.
Ovesen L, Brot C, Jakobsen J. Food contents and biological activity of 25-hydroxy- vitamin D: A vitamin D metabolite to be reckoned with? Ann Nutr Metab. 2003;47(3-4):107-113.
McDonnell SL, French CB, Heaney RP. Quantifying the food sources of basal vitamin D input.J Steroid Biochem Mol Biol. 2013;144(Pt A):149-151.
Crowe FL, SteurM,AllenNE,etal. Plasma concentrations of 25-hydroxyvitamin D in meat eaters, fish eaters, vegetarians and vegans: Results from the EPIC-Oxford study. Public Health Nutr. 2011;14(2):340-346.
Barger-Lux MJ, Heaney RP, Dowell S, et al. Vitamin D and its major metabolites: Serum levels after graded oral dosing in healthy men. Osteoporos Int. 1998;8(3):222-230.
Bischoff-Ferrari HA, Dawson-Hughes B, Stocklin E, et al. Oral supplementation with 25(OH)D(3) versus vitamin D(3): Effects on 25(OH)D levels, lower extremity function, blood pressure and markers of innate immunity. J Bone Miner Res 2012;27(1):160-169.
Cashman KD, Seamans KM, Lucey AJ, et al. Relative effectiveness of oral 25-hydroxyvitamin D3 and vitamin D3 in raising wintertime serum 25-hydroxyvitamin D in older adults. AmJClin Nutr 2012;95(6):1350-1356.
Maalouf J, Nabulsi M, Vieth R, et al. Short- and long-term safety of weekly high-dose vitamin D3 supplementation in school children. J Clin Endocrinol Metab2008;93(7):2693-2701.
Holvik K, Madar AA, Meyer HE, et al. A randomised comparison of increase in serum 25-hydroxyvitamin D concentration after 4 weeks ofdaily oral intake of 10 mg cholecalciferol from multivitamin tablets or fish oil capsules in healthy young adults. Br J Nutr 2007;98(3):620-625.
Biancuzzo RM, Young A, Bibuld D, et al. Fortification of orange juice with vitamin D(2) or vitamin D(3) is as effective as an oral supplement in maintaining vitamin D status in adults. AmJ Clin Nutr 2010;91(6):1621—1626.
Tangpricha V, Koutkia P, Rieke SM, et al. Fortification of orange juice with vitamin D: A novel approach for enhancing vitamin D nutritional health. Am J Clin Nutr 2003;77(6):1478-1483.
Dawson-Hughes B, Harris SS, Palermo NJ, et al. Meal conditions affect the absorption of supplemental vitamin D3 but not the plasma 25-hydroxyvitamin D response to supplementation. J Bone Miner Res 2013;28(8):1778-1783.
Mulligan GB, Licata A.Taking vitamin Dwiththe largest meal improves absorption and results in higher serum levels of 25-hydroxyvitamin D. J Bone Miner Res 2010;25(4):928-930.
Holick M. Sunlight, ultraviolet-radiation, vitamin D and skin cancer. How much sunlight do we need? In: J Reichrather, ed. Sunlight, Vitamin D and Skin Cancer. 2nd ed. New York, NY, Landes Bioscience and Springer Science; 2014:1—16.
Armas LA, Hollis BW, Heaney RP. Vitamin D2 is much less effective than vitamin D3 in humans.J Clin Endocrinol Metab 2004;89(11):5387—5391.
Tripkovic L, Lambert H, Hart K, et al. Comparison of vitamin D2 and vitamin D3 supplementation in raising serum 25-hydroxyvitamin D status: A systematic review and meta-analysis. AmJClin Nutr.2012;95:1357-1364.
Heaney RP, Recker RR, Grote J, et al. Vitamin D3 is more potent than vitamin D2 in humans. J Clin Endocrinol Metab 2011;96(3):E447—452. doi:10.1210/ jc.2010-2230
Tjellesen L, Hummer L, Christiansen C, et al. Serum concentration of vitamin D metabolites during treatment with vitamin D2 and D3 in normal premenopausal women. Bone Miner 1986;1(5):407—413.
Binkley N, Gemar D, Engelke J, et al. Evaluation of ergocalciferol or cholecalciferol dosing, 1,600 IU daily or 50,000 IU monthly in older adults. J Clin Endocrinol Metab 2011;96(4):981—988.
HeaneyRP, Davies KM, ChenTC,etal.Human serum 25-hydroxycholecalciferol response to extended oral dosing with cholecalciferol. Am J Clin Nutr 2003;77(1):204—210.
Powe CE, Evans MK, Wenger J, et al. Vitamin D-binding protein and vitamin D status of black Americans and white Americans. N Engl J Med 2013;369(21):1991—2000.
Bouillon R, Jones K. To the Editor: Vitamin D—binding protein and vitamin D in blacks and whites. N Engl J Med 2014;370(9):879.
Hollis BW, Bikle DD. To the Editor: Vitamin D—Binding protein and vitamin D in blacks and whites. N Engl J Med 2014;370(9):879—880.
Barger Lux MJ, Heaney RP. Effects of above average summer sun exposure on serum 25-hydroxyvitamin D and calcium absorption. J Clin Endocrinol Metab 2002;87(11):4952—4956.
Luxwolda MF, Kuipers RS, Kema IP, et al. Traditionally living populations in east Africa have a mean serum 25-hydroxyvitamin D concentration of115 nmol/l. BrJNutr2012;108(9):1557—1561.
Zhu JG, Ochalek JT, Kaufmann M, et al. CYP2R1 is a major, but not exclusive, contributor to 25-hydroxyvitamin D production in vivo. Proc Natl Acad Sci U S A 2013;110(39):15650—15655.
Zhu J, DeLuca HF. Vitamin D 25-hydroxylase — Four decades of searching, are we there yet? Arch Biochem Biophys. 2012;523(1):30—36.
Bikle DD, Halloran BP, Riviere JE. Production of 1,25 dihydroxyvitamin D3 by perfused pig skin.J Invest Dermatol 1994;102(5):796—798.
Ilahi M, Armas LA, Heaney RP. Pharmacokineticsofa single, large dose ofcholecalciferol. Am J Clin Nutr 2008;87(3):688—691.
Zhou Y, Zhao LJ, Xu X, et al. DNA methylation levels of CYP2R1 and CYP24A1 predict vitamin D response variation. J Steroid Biochem Mol Biol 2014;144(Pt A):207—214.
Heaney RP, Armas LA, Shary JR, et al. 25-hydroxylation of vitamin D3: Relation to circulating vitamin D3 under various input conditions. Am J Clin Nutr 2008;87(6):1738—1742.
Amrein K, Worm HC, Schilcher G, et al. A challenging case of hypocalcemia supporting the concept that 25-hydroxyvitamin D status is important for intestinal calcium absorption.J Clin Endocrinol Metab 2012;97(6):1842—1846.
Bordier P, Rasmussen H, Marie P, et al. Vitamin D metabolites and bone mineralization in man. J Clin Endocrinol Metab 1978;46(2):284—294.
Lund RJ, Andress DL, Amdahl M, et al. Differential effects of paricalcitol and calcitriol on intestinal calcium absorption in hemodialysis patients. Am J Nephrol 2010;31(2):165—170.
Nordin B. Plasma calcium and plasma magnesium homeostasis. In: B Nordin, ed. Calcium, Phosphate and Magnesium Metabolism. London: Churchill Livingstone; 1976:186—216.
Hollis BW, Wagner CL. The role ofthe parent compound vitamin D with respect to metabolism and function: Why clinical dose intervals can affect clinical outcomes. J Clin Endocrinol Metab 2013;98(12):4619—4628.
Clements MR, Davies M, Fraser DR, et al. Metabolic inactivation of vitamin D is enhanced in primary hyperparathyroidism. Clin Sci (Lond) 1987;73(6):659—664.
Clements MR, Johnson L, Fraser DR. A new mechanism for induced vitamin D deficiency in calcium deprivation. Nature 1987;325(6099):62—65.
Clements MR, Davies M, Hayes ME, et al. The role of 1,25-dihydroxyvitamin D in the mechanism of acquired vitamin D deficiency. Clin Endocrinol (Oxf) 1992;37(1):17—27.
Hollis BW, Pittard WB 3rd, Reinhardt TA. Relationships among vitamin D, 25- hydroxyvitamin D, and vitamin D-binding protein concentrations in the plasma and milkofhuman subjects.J Clin Endocrinol Metab 1986;62(1 ):41 —44.
Oberhelman SS, Meekins ME, Fischer PR, et al. Maternal vitamin D supplementation to improve the vitamin D status of breast-fed infants: A randomized controlled trial. Mayo Clin Proc 2013;88(12):1378—1387.
Lo CW, Paris PW, Clemens TL, et al. Vitamin D absorption in healthy subjects and in patients with intestinal malabsorption syndromes. Am J Clin Nutr 1985;42(4):644—649.
Vieth R. How to optimize vitamin D supplementation to prevent cancer, based on cellular adaptation and hydroxylase enzymology. Anticancer Res 2009;29(9): 3675—3684.
Vieth R. Simple method for determining specific binding capacity of vitamin D-binding protein and its use to calculate the concentration of "free" 1,25- dihydroxyvitamin D. Clin Chem 1994;40(3):435—441.
Sanders KM, Stuart AL, Williamson EJ, et al. Annual high-dose oral vitamin D and falls and fractures in older women: A randomized controlled trial. JAMA 2010;303(18):1815—1822.
Smith H, Anderson F, Raphael H, et al. Effect of annual intramuscular vitamin D on fracture risk in elderly men and women—a population-based, randomized, double-blind, placebo-controlled trial. Rheumatology (Oxford) 2007;46(12): 1852-1857.
Standing Committee on the Scientific Evaluation of Dietary Reference Intakes. Dietary Reference Intakes for Calcium, Phosphorus, Magnesium, Vitamin D, and Fluoride. Washington, DC: National Academy Press; 1997.
Wortsman J, Matsuoka LY, Chen TC, et al. Decreased bioavailability of vitamin D in obesity. Am J Clin Nutr 2000;72(3):690-693.
Drincic AT, Armas LA, Van Diest EE, et al. Volumetric dilution, rather than sequestration best explains the low vitamin D status of obesity. Obesity (Silver Spring) 2012;20(7):1444-1448.
Henriksen VT, Rogers VE, Rasmussen GL, et al. Pro-inflammatory cytokines mediate the decrease in serum 25(OH)D concentrations after total knee arthroplasty? Med Hypotheses. 2014;82(2):134-137.
Barker T, Martins TB, Hill HR, et al. Circulating pro-inflammatory cytokines are elevated and peak power output correlates with 25-hydroxyvitamin D in vitamin D insufficient adults. Eur J Appl Physiol 2013;113(6):1523-1534.
Duncan A, Talwar D, McMillan DC, et al. Quantitative data on the magnitude of the systemic inflammatory response and its effect on micronutrient status based on plasma measurements. Am J Clin Nutr 2012;95(1):64-71.
Waldron JL, Ashby HL, Cornes MP, et al. Vitamin D: A negative acute phase reactant. J Clin Pathol 2013;66(7):620-622.
Reid D, Toole BJ, Knox S, et al. The relation between acute changes in the systemic inflammatory response and plasma 25-hydroxyvitamin D concentrations after elective knee arthroplasty. AmJClin Nutr 2011 ;93(5):1006-1011.
Louw JA, Werbeck A, Louw ME, et al. Blood vitamin concentrations during the acute-phase response.Crit Care Med. 1992;20(7):934-941.
Autier P, Boniol M, Pizot C, et al. Vitamin D status and ill health: A systematic review. Lancet Diabetes Endocrinol 2014;2(1):76-89.
St-Arnaud R. CYP24A1: Structure, function, and physiological role. In: D Feldman, J Pike, J Adams, eds. Vitamin D. Vol. Chapter 4. 3rd ed. San Diego, CA: Academic Press; 2011:43-56.
Holick MF, Schnoes HK, DeLuca HF, et al. Isolation and identification of 24,25- dihydroxycholecalciferol, a metabolite of vitamin D made in the kidney. Biochemistry1972;11(23):4251-4255.
Seo EG, Einhorn TA, Norman AW. 24R,25-dihydroxyvitamin D3: An essential vitamin D3 metabolite for both normal bone integrity and healing oftibial fracture in chicks. Endocrinology 1997;138(9):3864-3872.
Wagner D, Hanwell HE, Schnabl K, et al. The ratio ofserum 24,25-dihydroxyvitamin D(3) to 25-hydroxyvitamin D(3) is predictive of 25-hydroxyvitamin D(3) response to vitamin D(3) supplementation. J Steroid Biochem Mol Biol 2011;126(3-5):72-77.
Armas L, Byford V, Kaufmann M, et al. Raising 25(OH)D levels has no effect on 24,25(OH)2D in dialysis patients. Presented at the 17th Workshop on Vitamin D. Chicago, IL, June 17-20,2014.
McCann JC, Ames BN. Vitamin K, an example of triage theory: Is micronutrient inadequacy linked to diseases ofaging? Am J Clin Nutr. 2009;90(4):889-907.
Liu PT, Stenger S, Li H, et al. Toll-like receptor triggering of a vitamin D-mediated human antimicrobial response.Science 2006;311 (5768):1770-1773.
Keith ME, LaPorta E, Welsh J. Stable expression of human VDR in murine VDR-null cells recapitulates vitamin D mediated anti-cancer signaling. Mol Carcinog 2014;53(4):286-299.
Milani C, Katayama ML, de Lyra EC, et al. Transcriptional effects of 1,25 dihydroxyvitamin D(3) physiological and supra-physiological concentrations in breastcancer organotypic culture. BMC Cancer 2013;13:119. doi:10.1186/1471-2407-13-119.
Hypponen E, Laara E, Reunanen A, et al. Intake of vitamin D and risk of type 1 diabetes: A birth-cohort study. Lancet 2001;358(9292):1500—1503.
See also VitaminDWiki
Click on charts for details
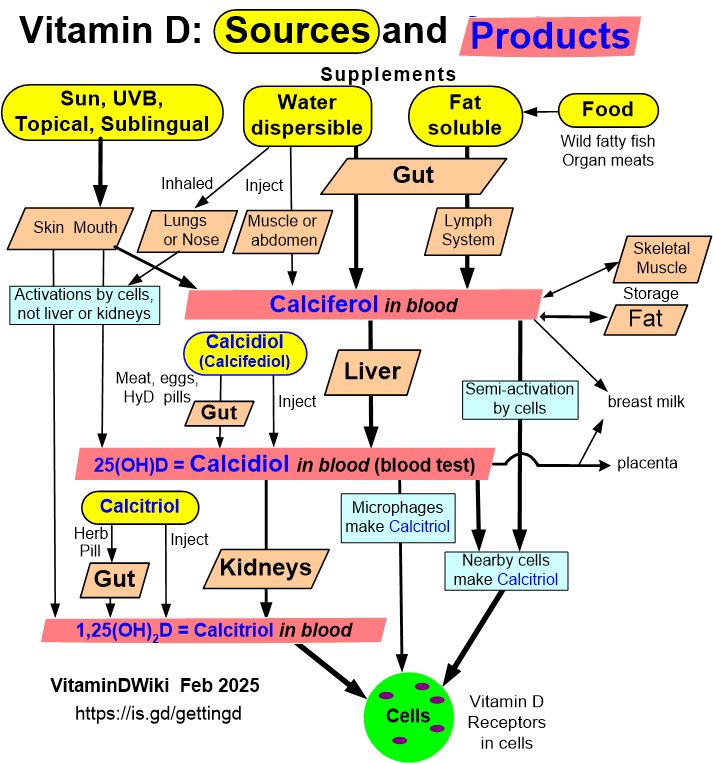
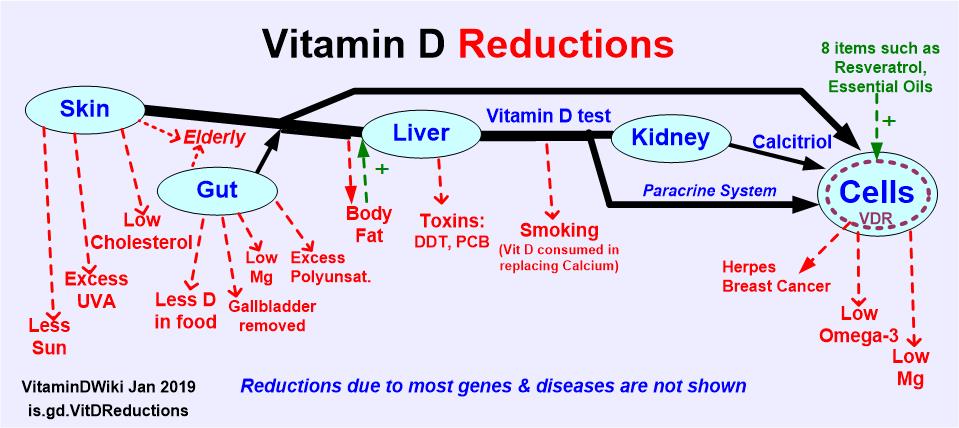
Short url = http://is.gd/heaney2014